Understanding Divergence: A Practical Guide to the Four Key Formations
In technical analysis, few concepts are as useful for anticipating potential price reversals and trend continuations as divergence. Divergence occurs when the direction of a security’s price and the direction of a technical indicator (typically a momentum oscillator) do not align. This disagreement between price and momentum provides traders with powerful visual clues about the underlying health and potential future direction of a market trend.
A technical oscillator (like the Relative Strength Index (RSI), Stochastics, or MACD, represented by the blue line in our examples) is designed to track price momentum. When a market trend is strong, price and momentum generally move in lockstep. Divergence is the crucial moment when this relationship breaks down, signaling a potential shift.
We can categorize divergence into four fundamental formations, which are clearly illustrated in the accompanying diagrams. These formations fall into two main groups: Regular Divergence (reversal signals) and Hidden Divergence (continuation signals).
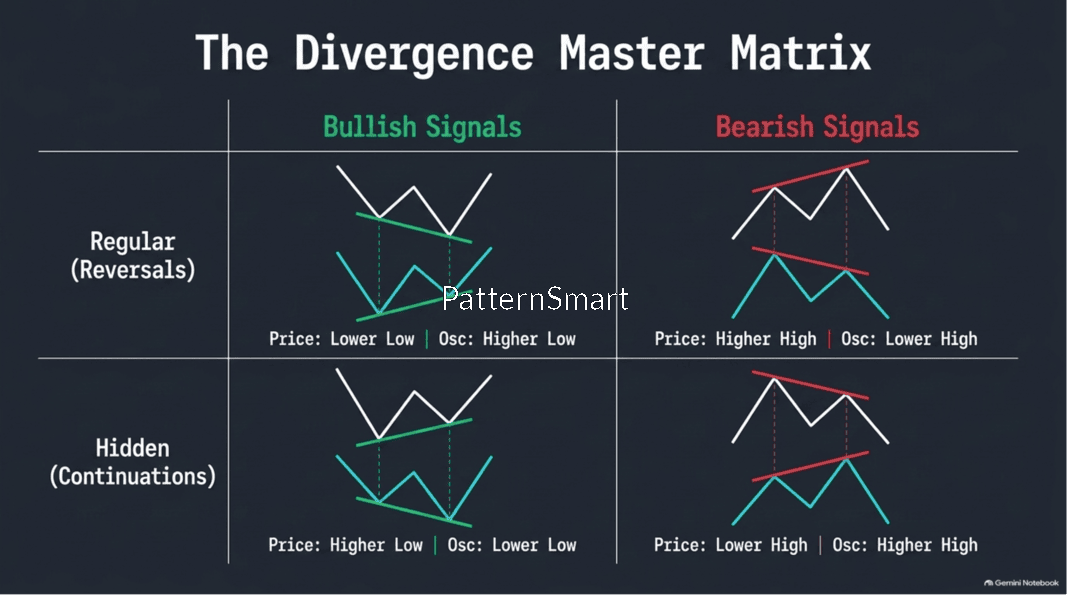
Part 1: Regular Divergence (Trend Reversal Signals)
Regular divergence is a powerful indicator that an existing trend is losing momentum and a potential reversal is on the horizon. This type of divergence focuses on a lack of momentum support for the current price action.
1. Regular Bearish Divergence (Signals Upward Exhaustion)
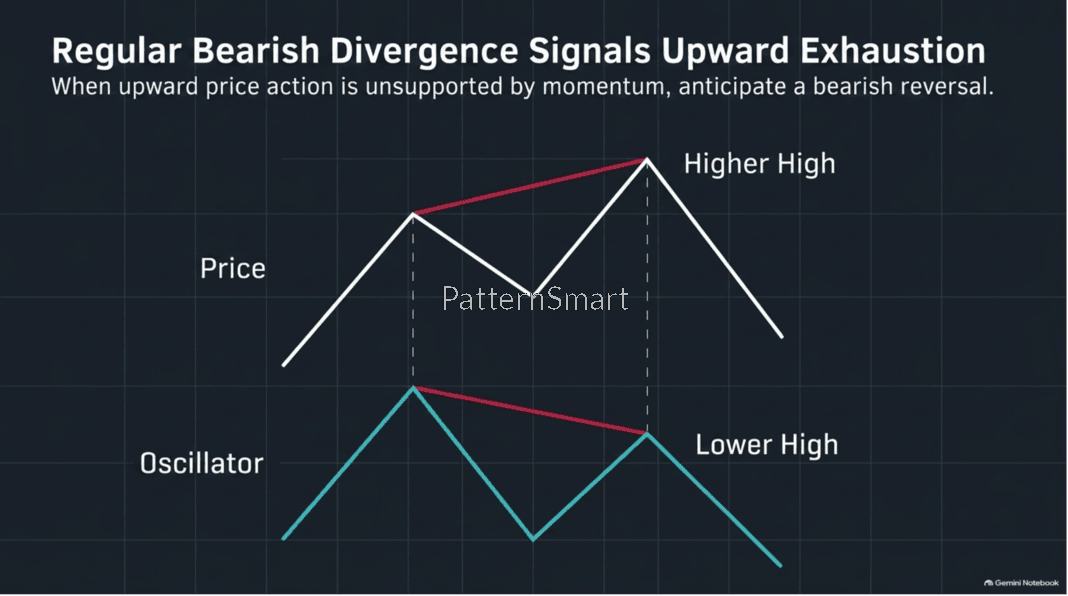
Regular Bearish Divergence is found in an established uptrend.
- The Price Action: The security’s price (the white line) is making a series of Higher Highs, indicating a clear, ongoing uptrend. It makes a second, higher peak than the first.
- The Oscillator’s Story: Despite the price achieving a new high, the corresponding oscillator (the blue line) makes a Lower High. It is unable to surpass its previous peak.
- The Analysis: The diagram’s title is explicit: “When upward price action is unsupported by momentum, anticipate a bearish reversal.” Even though buyers have pushed the price higher, the underlying momentum is fading. This is a clear signal of trend exhaustion. The failure of momentum to support the new price high suggests that the buying pressure is drying up, and a reversal to a downtrend (or at least a significant correction) is likely.
2. Regular Bullish Divergence (Signals Trend Exhaustion)
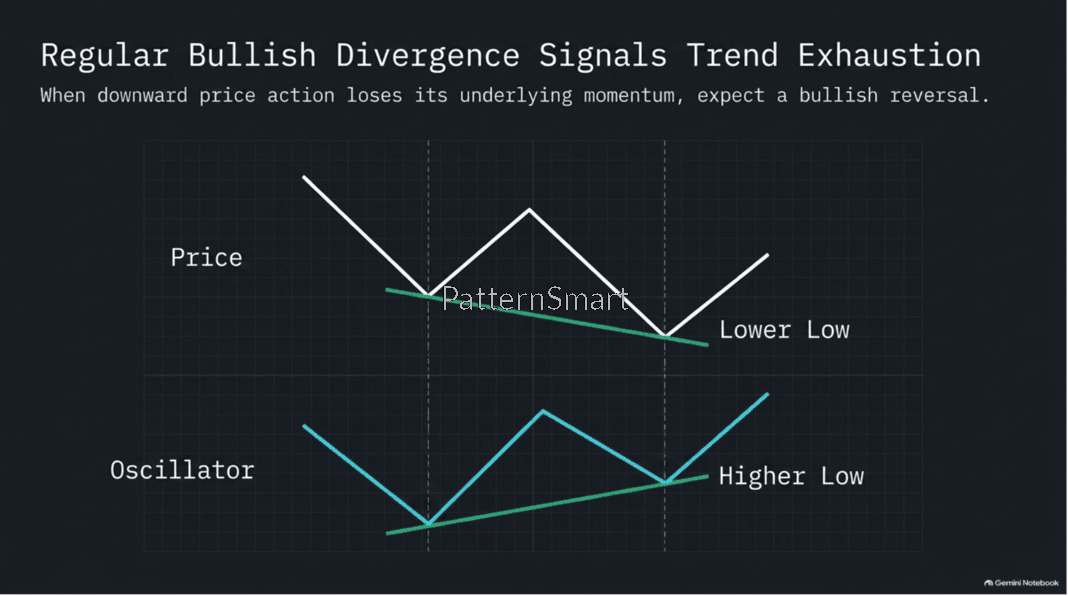
Regular Bullish Divergence is found at the potential end of a downtrend.
- The Price Action: The price (white line) is in a downward trend, making a Lower Low. This shows that the bearish pressure is still dominant, forcing the price down past its previous low point.
- The Oscillator’s Story: The oscillator (blue line), which tracks the momentum of this decline, fails to follow suit. Instead, it makes a Higher Low.
- The Analysis: “When downward price action loses its underlying momentum, expect a bullish reversal.” This divergence reveals that the downward price push is a “last gasp.” Sellers are still present, but their aggressive momentum is spent. The oscillator’s higher low indicates a subtle shift—a reduction in bearish power—even as the price is making a nominal new low. This is a common pattern for a trend floor or bottom, signaling that a bullish reversal could be near.
Part 2: Hidden Divergence (Trend Continuation Signals)
Hidden divergence operates under a different principle. Rather than signaling a reversal, it confirms that the current trend has sufficient strength to continue. This formation looks for situations where momentum resets aggressively during a price consolidation, creating a “spring-loaded” setup for the trend to resume.
3. Hidden Bearish Divergence (Exposes Underlying Weakness)
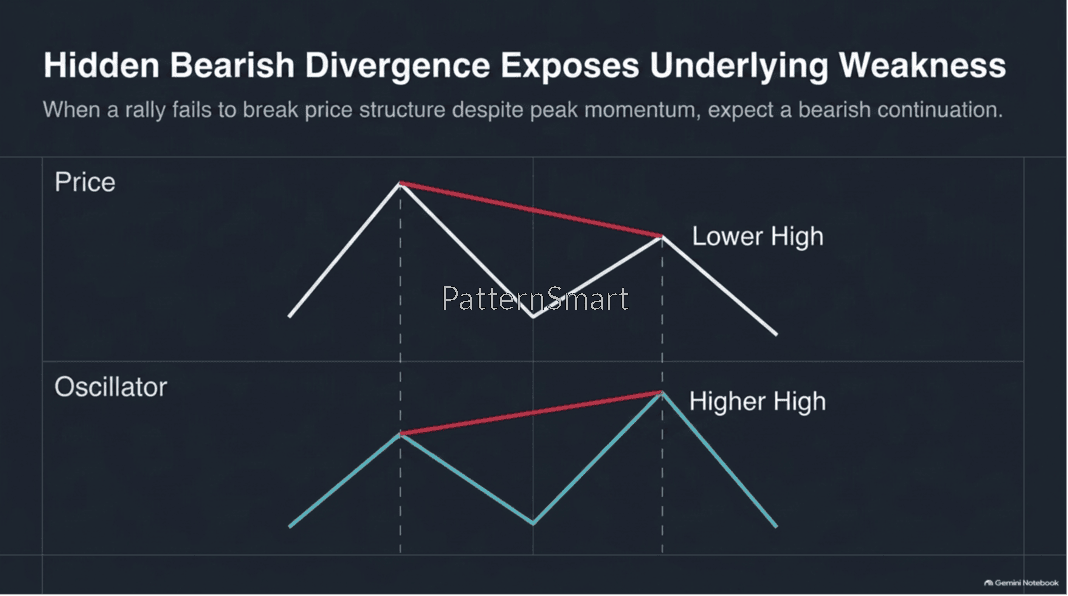
Hidden Bearish Divergence occurs during a correction within an overall downtrend.
- The Price Action: In a broader downtrend, the price (white line) makes a rally, or a counter-trend correction. Crucially, this rally fails to break the existing price structure; it only manages to form a Lower High. This price peak is lower than the previous major high.
- The Oscillator’s Story: During this same rally, the momentum oscillator (blue line) surges back aggressively. It makes a Higher High, exceeding its previous peak. The text notes this rally is “despite peak momentum.”
- The Analysis: The diagram states: “When a rally fails to break price structure despite peak momentum, expect a bearish continuation.” This is a profound insight. The fact that the oscillator has returned to a “peak” level, but the price could only achieve a lower high, reveals profound underlying weakness. If a full force of momentum cannot even push the price to its previous high, it means the broader bearish trend is powerful and the correction was simply a temporary pause. The setup points towards a likely resumption of the downtrend.
4. Hidden Bullish Divergence (Confirms Trend Strength)
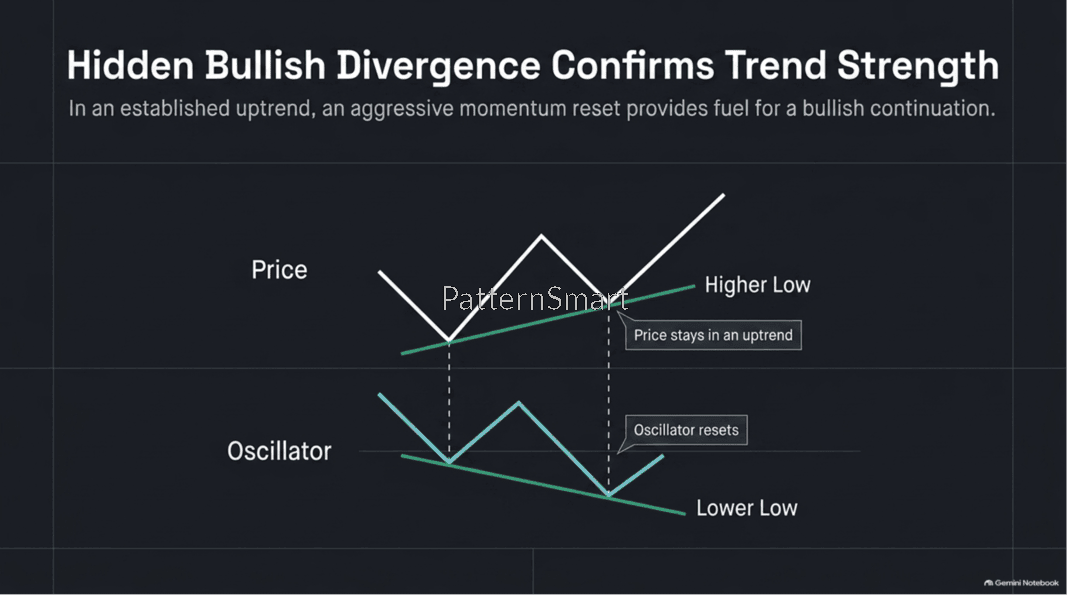
Hidden Bullish Divergence is found during a shallow correction within an established uptrend.
- The Price Action: In a strong uptrend, the price (white line) experiences a minor pull-back. It finds support and forms a Higher Low. This price low is higher than the previous major low, meaning the price structure of the uptrend remains intact.
- The Oscillator’s Story: During this shallow price correction, the oscillator (blue line) “resets.” It sells off deeply and makes a Lower Low, going significantly below its previous low. The chart labels this as an “aggressive momentum reset.”
- The Analysis: The diagram explains: “In an established uptrend, an aggressive momentum reset provides fuel for a bullish continuation.” This formation is highly desirable for trend traders. The key observation is that momentum has reset to a very low level, but the price has barely reacted. The fact that price is “staying in an uptrend” despite the intense sell-off in momentum demonstrates tremendous underlying buying power. This reset gives the trend “fresh fuel” to continue its upward trajectory, making it a powerful “buy the dip” signal.
Conclusion
Understanding divergence is a critical skill for any technical analyst. By paying attention to when price and momentum are not agreeing, traders can anticipate trend exhaustion points (using Regular Divergence) or confirm the powerful resume-signal of a strong trend (using Hidden Divergence). Integrating these four formations can transform an oscillator from a simple overbought/oversold gauge into a leading indicator of major market shifts.