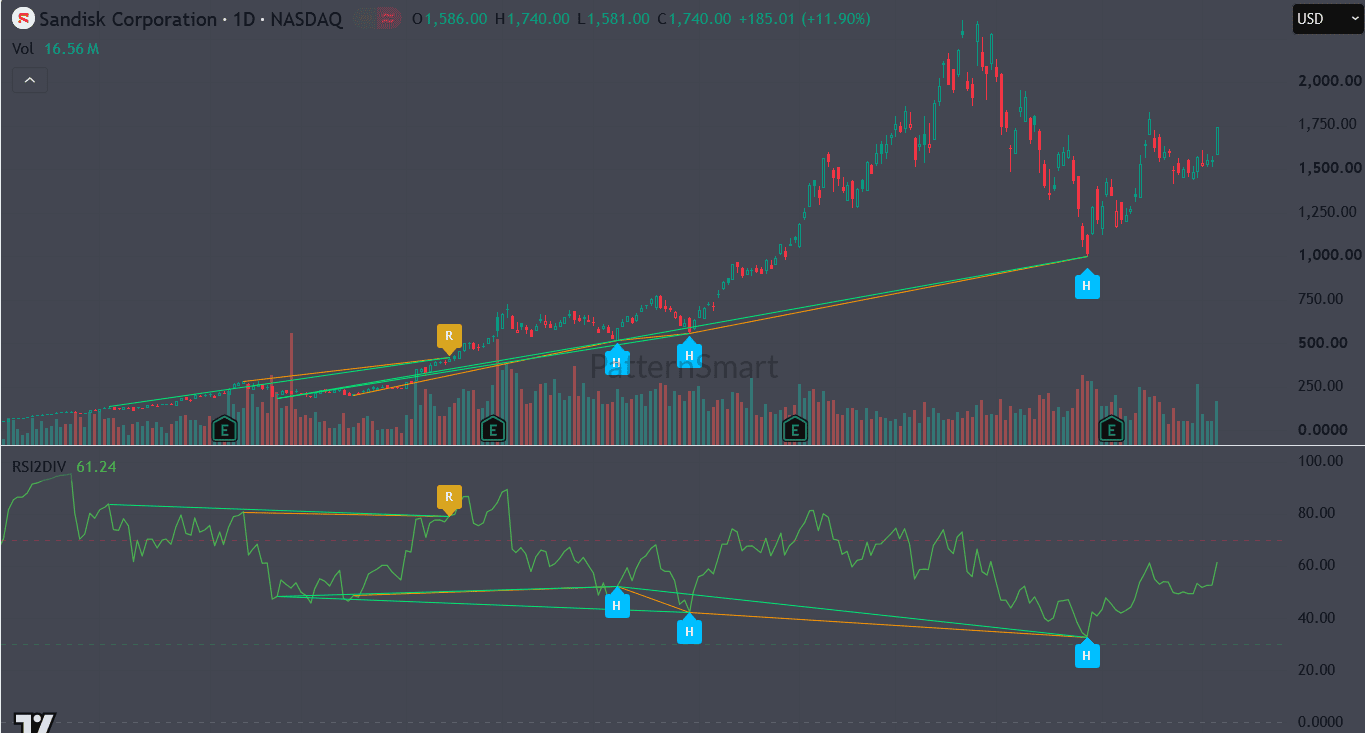
1. SNDK Double Divergence Analysis on TradingView: Strong Bullish Momentum Reignition
Sandisk Corporation (SNDK), listed on NASDAQ, represents a high-beta technology asset currently exhibiting strong macro bullish momentum on the daily (1D) timeframe. Technical structures on the TradingView platform reveal a series of highly reliable divergence signals generated by the RSI Double Divergence (RSI2DIV) indicator, signaling that institutional buyers remain firmly in control of the broader trend.
- Primary Signal: A massive Hidden Bullish Divergence (‘H’) printed at the 1,000.00 structural support level, invalidating the previous macro pullback from all-time highs above 2,000.00.
- Current Price Action: SNDK closed at 1,740.00 (+185.01 / +11.90%) with daily high touching 1,740.00 on heavy volume of 16.56M, pushing the RSI2DIV value back to 61.24.
- Market Bias: Strongly Bullish with high probability of testing peak liquidity zones near 2,000.00 – 2,100.00.
2. Chart Analysis & Signal Breakdown
As observed on the TradingView chart, the RSI Double Divergence indicator effectively mapped out multiple distinct market cycles across the daily structure of SNDK:
Regular Bearish Divergence (‘R’) — Phase 1
During the initial leg up around the 450.00 – 500.00 price zone, price printed a higher high while the RSI formed a lower peak, triggering a Regular Bearish Divergence (‘R’) signal (highlighted by the yellow tag). This signal marked momentum exhaustion in the short term, leading to a temporary consolidation period rather than a macro trend reversal.
Structural Hidden Bullish Divergence (‘H’) — Phase 2 & 3
- Mid-Trend Accumulation: During the consolidation phase near 500.00 – 600.00, two successive Hidden Bullish Divergence (‘H’) blue signals were logged. Price maintained significantly higher structural lows while the RSI indicator registered lower lows, confirming institutional re-accumulation before the vertical expansion toward 2,000.00+.
- Macro Higher-Low Defense: Following a sharp drop from above 2,000.00, SNDK found strong support at 1,000.00. Price established a massive higher low relative to the multi-year 500.00 base. Simultaneously, the RSI oscillator dropped into deeply oversold territory (~25.00 level), printing a textbook Hidden Bullish Divergence (‘H’) signal spanning across macro swings.
Confirmation & Market Context
Confirmation of the latest Hidden Bullish Divergence occurred as price reacted violently off the 1,000.00 level with a single-day +11.90% expansion bar to 1,740.00. The sharp surge in daily volume (16.56M) alongside an RSI recovery to 61.24 confirms that sellers have exhausted their momentum and buyers are re-asserting control over the primary macro uptrend.
3. Trading Setup & Risk Management
Based strictly on the RSI Double Divergence setup on the TradingView 1D chart, the structural parameters are defined as follows:
- Entry Zone: Market execution near current levels (1,740.00) or on minor intraday pullbacks toward 1,600.00 – 1,650.00.
- Stop-Loss / Invalidation: Placed below the structural low at 1,000.00 (or conservative trailing stop below 1,450.00 to protect gains).
- Upside Targets:
- Target 1: 1,950.00 (Local swing high resistance).
- Target 2: 2,100.00 (Macro all-time high liquidity sweep zone).
- Risk-to-Reward Ratio: Highly favorable asymmetric profile favoring trend continuation traders.