Market Overview
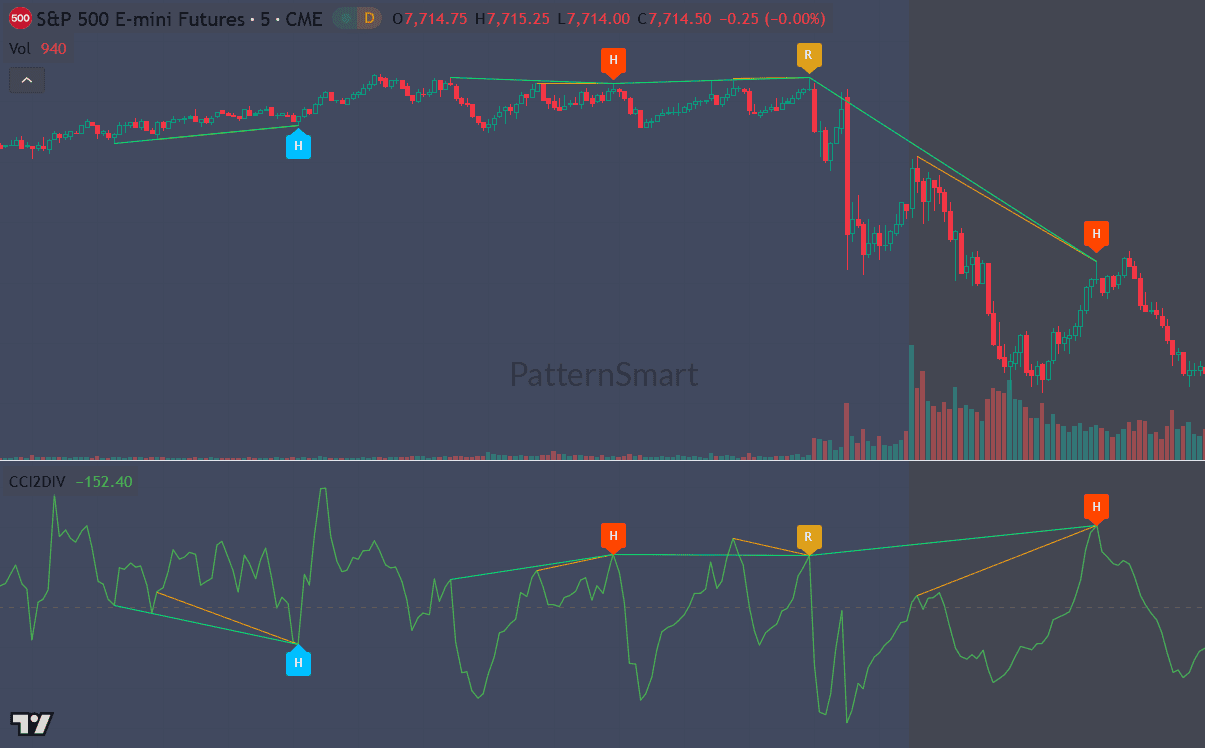
The attached chart shows the E-mini S&P 500 Futures (ES) on a 5-minute timeframe. The price structure begins with a gradual upward progression, but the character of the market changes significantly near the right side of the chart.
The initial advance develops through a series of higher highs and higher lows. Later, price reaches another high and begins to weaken. A sharp downside move then develops, followed by a corrective rebound and another lower high. By the end of the displayed sequence, the market is trading within a clearly developing bearish structure.
This transition is particularly useful for studying CCI Double Divergence, because CCI is designed to evaluate price deviation from its statistical average and can provide information about changing market expansion, momentum deterioration, and cyclical behavior.
The broader ES environment can also change rapidly in response to macroeconomic information. For example, on September 4, 2026, S&P 500 futures turned lower after a stronger-than-expected U.S. employment report, illustrating why intraday divergence analysis should always be considered alongside the larger market environment. (Yahoo Finance)
The important lesson, however, is not simply whether ES goes up or down. It is how the relationship between price and CCI changes as the market moves through different phases.
Understanding CCI in This Chart
The Commodity Channel Index, or CCI, measures how far price has deviated from its statistical average.
Unlike bounded oscillators, CCI is unbounded. Larger positive or negative readings represent stronger deviations from normal market behavior. This makes CCI particularly useful for studying market expansion and contraction rather than simply labeling conditions as overbought or oversold.
For Double Divergence analysis, the key question becomes:
Is price still extending in the same direction, while CCI is becoming less supportive of that movement?
That question is more useful than simply asking whether CCI is high or low.
In the chart, the CCI panel allows us to compare the progression of indicator highs and lows directly with the corresponding price structures.
First Observation: Hidden Bullish Double Divergence
On the left portion of the chart, the first blue H appears around a price pullback.
The important relationship is:
- Price: forms a higher low.
- CCI: forms a lower low.
This is the structure of Bullish Hidden Divergence. The methodology defines Bullish Hidden Divergence as a higher price low accompanied by a lower indicator low. It is generally associated with an established bullish trend that is undergoing a temporary correction rather than necessarily beginning a major reversal.
What does this tell us?
The price structure remains bullish because the pullback does not violate the previous structural low.
At the same time, CCI makes a deeper move downward.
This creates an interesting distinction:
Price structure remains constructive while CCI experiences a deeper momentum reset.
From a technical-analysis perspective, this can suggest that the broader upward structure is still intact even though short-term price behavior has weakened.
This is why Hidden Divergence should not automatically be interpreted as a reversal signal. Its analytical role is different from Regular Divergence: it can contribute to evaluating trend continuation and pullback conditions.
The subsequent price action supports this interpretation. After the blue H observation, ES continues higher and eventually reaches another significant high.
The Market Then Reaches an Important High
After the bullish continuation phase, ES advances toward the upper portion of the chart.
At this stage, the market begins showing a different characteristic.
Price is still capable of reaching new highs, but the CCI structure is no longer advancing at the same rate.
This is where CCI Double Divergence becomes particularly informative.
CCI is not simply telling us that price is “overextended.” Instead, the comparison is asking whether the magnitude of the latest price expansion is being supported by the corresponding CCI movement.
That distinction is central to the PatternSmart approach.
A divergence is information—not a prediction. The methodology emphasizes evaluating price action, indicator behavior, market structure, and additional confirmation together rather than treating a divergence as an isolated trading instruction.
Bearish Regular Double Divergence: The First Warning
Near the upper-middle portion of the chart, an orange R appears.
Here the structure is:
- Price: makes a higher high.
- CCI: makes a lower high.
This is Bearish Regular Divergence. Under the PatternSmart methodology, this relationship indicates that the indicator is no longer confirming the full strength of the upward price movement.
This is an important analytical distinction.
Price is still moving upward.
Therefore, a trader looking only at price could reasonably conclude that the bullish trend remains intact.
CCI, however, provides a different perspective.
The new price high is not accompanied by a corresponding new CCI high. The upward price expansion is therefore becoming less supported from the perspective measured by CCI.
What should we conclude?
Not that the market must immediately reverse.
Instead:
The quality of the current upward expansion deserves closer evaluation.
This is exactly where the confirmation-based Double Divergence methodology becomes important. The methodology emphasizes that divergence represents additional evidence rather than certainty, and that market context determines its significance.
Why the Price Action After the Bearish Divergence Matters
The most useful part of the chart is what happens next.
Following the bearish Regular Double Divergence, ES experiences a sharp downside expansion.
The decline is not merely a small pullback. Price breaks substantially lower and begins establishing a new bearish structure.
This subsequent movement gives the earlier divergence greater analytical significance in hindsight.
But this distinction is important:
The later decline does not mean the divergence predicted it with certainty.
Rather, the divergence identified a condition in which the upward price movement was no longer receiving the same degree of support from the behavior measured by CCI.
That observation became more meaningful as price subsequently confirmed a structural change.
This is the difference between analysis and prediction.
The Transition From Bullish Structure to Bearish Structure
The chart provides a particularly clear example of why market context matters.
Before the bearish divergence:
Higher highs + higher lows
After the divergence:
Sharp decline → rebound → lower high → renewed decline
The market has therefore changed from an advancing structure into a declining structure.
This means the interpretation of subsequent CCI signals should also change.
A trader should not continue treating every CCI divergence as though the market were still in the original bullish phase.
The market context has changed.
That is one of the central principles of Double Divergence analysis: signal classification alone is insufficient. Trend direction, volatility, market structure, support and resistance, and additional confirmation all influence interpretation.
Bearish Hidden Double Divergence: Continuation After the Rebound
The next important observation appears on the right side of the chart.
After the sharp decline, ES rebounds.
However, the rebound does not recover the previous major high. Instead, price forms a lower high.
At approximately the same structural stage, CCI forms a higher high.
This creates:
- Price: lower high
- CCI: higher high
That is Bearish Hidden Divergence.
This signal has a fundamentally different meaning from the earlier Bearish Regular Divergence.
Regular Bearish Divergence
Higher price high + lower CCI high
→ May indicate weakening bullish conditions.
Hidden Bearish Divergence
Lower price high + higher CCI high
→ May indicate that bearish conditions remain consistent despite a temporary upward correction.
The distinction is critical.
The market has already shifted into a bearish structure. The rebound therefore needs to be evaluated as a possible correction within that bearish structure rather than automatically interpreted as the beginning of a new bullish trend.
The Hidden Bearish Double Divergence provides additional evidence supporting that interpretation.
Why the Three Signals Should Be Read Together
The strongest educational value of this chart comes from looking at the sequence, rather than studying each signal independently.
Stage 1 — Bullish Hidden Divergence
Price maintains a higher low while CCI makes a lower low.
Interpretation: the broader bullish structure remains potentially intact despite a deeper momentum reset.
Stage 2 — Bearish Regular Divergence
Price reaches a higher high while CCI makes a lower high.
Interpretation: the latest bullish expansion is losing CCI support and deserves closer evaluation.
Stage 3 — Market Structure Changes
Price experiences a substantial decline and begins producing lower highs.
Interpretation: the market context has shifted from bullish expansion toward bearish structure.
Stage 4 — Bearish Hidden Divergence
Price produces a lower high while CCI produces a higher high.
Interpretation: the upward correction is not accompanied by a corresponding deterioration of the bearish price structure, supporting continued evaluation of the bearish trend.
This sequence demonstrates why Double Divergence is a methodology rather than simply a collection of signals. The same indicator can provide different analytical information depending on where the market is within its structural cycle.
Market Context Is More Important Than the Marker
One of the easiest mistakes when using divergence is to focus on the colored marker while ignoring the chart surrounding it.
Consider the final Bearish Hidden Double Divergence.
If it appeared during a strong bullish market with higher highs and higher lows, its interpretation would be different.
Here, however, it appears after:
- A major decline.
- A rebound.
- A lower high.
- Renewed downside pressure.
That context makes the Hidden Bearish observation much more relevant to bearish continuation analysis.
This is why PatternSmart’s CCI methodology recommends a workflow that begins with identifying the prevailing trend, then observing CCI behavior, evaluating Double Divergence confirmation, and finally considering price structure and support or resistance.
Using CCI Double Divergence on TradingView
TradingView provides a cloud-based, interactive charting environment that is well suited to visual technical analysis and multi-device workflows. Its synchronized workspace and flexible charting environment allow traders to review price structure and indicator behavior efficiently.
For this type of analysis, the important advantage is not simply displaying a CCI line.
The value comes from being able to visually compare:
- price swing highs and lows,
- CCI swing highs and lows,
- Regular Divergence,
- Hidden Divergence,
- and the resulting market structure.
The PatternSmart Double Divergence implementation can also display structural divergence lines, making the relationship between price extremes and corresponding indicator extremes easier to examine. The Show Line feature controls this visualization.
For traders who prefer additional confirmation before treating a divergence as finalized, Wait 1 Bar is another relevant feature. When enabled, the indicator waits for one completed confirmation bar before finalizing the detected divergence.
These features should be viewed as analytical tools rather than substitutes for market interpretation.
What This ES Chart Teaches About CCI Divergence
There are several broader lessons contained in this single example.
1. CCI is more than an overbought/oversold tool
The more useful question is whether price deviation and momentum are developing consistently with price structure.
CCI’s ability to reflect the magnitude of deviation makes it particularly useful for studying market expansion, contraction, and normalization.
2. Regular and Hidden Divergence serve different analytical purposes
Regular Divergence can contribute to reversal analysis.
Hidden Divergence can contribute to continuation analysis.
Treating both as the same type of signal removes much of the information contained in the methodology.
3. Divergence can precede structural change
The bearish Regular Double Divergence appeared while price was still making higher highs.
The structural deterioration became visible afterward.
This is one reason divergence can be useful as an early analytical observation, while still requiring confirmation.
4. A divergence does not override the trend
The final Hidden Bearish Double Divergence becomes meaningful because it occurs within a developing bearish structure.
Market context remains essential.
5. Confirmation matters
The PatternSmart methodology does not treat divergence as certainty. Instead, it encourages traders to combine indicator behavior with price action, market structure, support and resistance, volatility, and other technical evidence.
Educational Conclusions
This ES 5-minute chart provides a useful example of how CCI Double Divergence can be interpreted as a sequence of changing market information rather than a series of isolated trading signals.
The initial Bullish Hidden Double Divergence occurs during an otherwise constructive price structure and helps describe the pullback as potentially compatible with continuation.
The later Bearish Regular Double Divergence occurs as price reaches a new high but CCI fails to confirm that expansion. It identifies a developing inconsistency between price and CCI that deserves further evaluation.
The subsequent sharp decline changes the market context. Once ES begins forming lower highs, the later Bearish Hidden Double Divergence takes on a different role: it contributes additional evidence that the rebound may be a correction within the developing bearish structure.
The broader lesson is therefore not simply “buy on bullish divergence” or “sell on bearish divergence.”
A more disciplined approach is:
Read the price structure → understand what CCI is measuring → identify the divergence → evaluate the market context → seek additional confirmation → then make an informed decision.
That process reflects the central PatternSmart principle that confirmation is more valuable than isolated signals, and divergence is analytical evidence rather than certainty.
CCI Double Divergence is most useful when it helps traders ask better questions about market behavior: Is price expansion still being supported? Is momentum deteriorating? Is the market correcting or actually changing structure? And does the latest divergence fit the broader technical picture?
Those questions turn divergence from a simple chart marker into a more structured framework for technical analysis.