Navigating digital asset markets requires analytical tools that can evaluate whether underlying market momentum supports visible price action. While traditional price charts display raw directional movement, they often mask subtle shifts in cyclical strength.
The PatternSmart CCI Double Divergence indicator for TradingView addresses this challenge by combining statistical price deviation analysis with a structured, confirmation-first divergence framework. By measuring how far price strays from its historical average and comparing those extremes to actual price behavior, this methodology helps traders evaluate whether market trends continue to receive genuine momentum support.
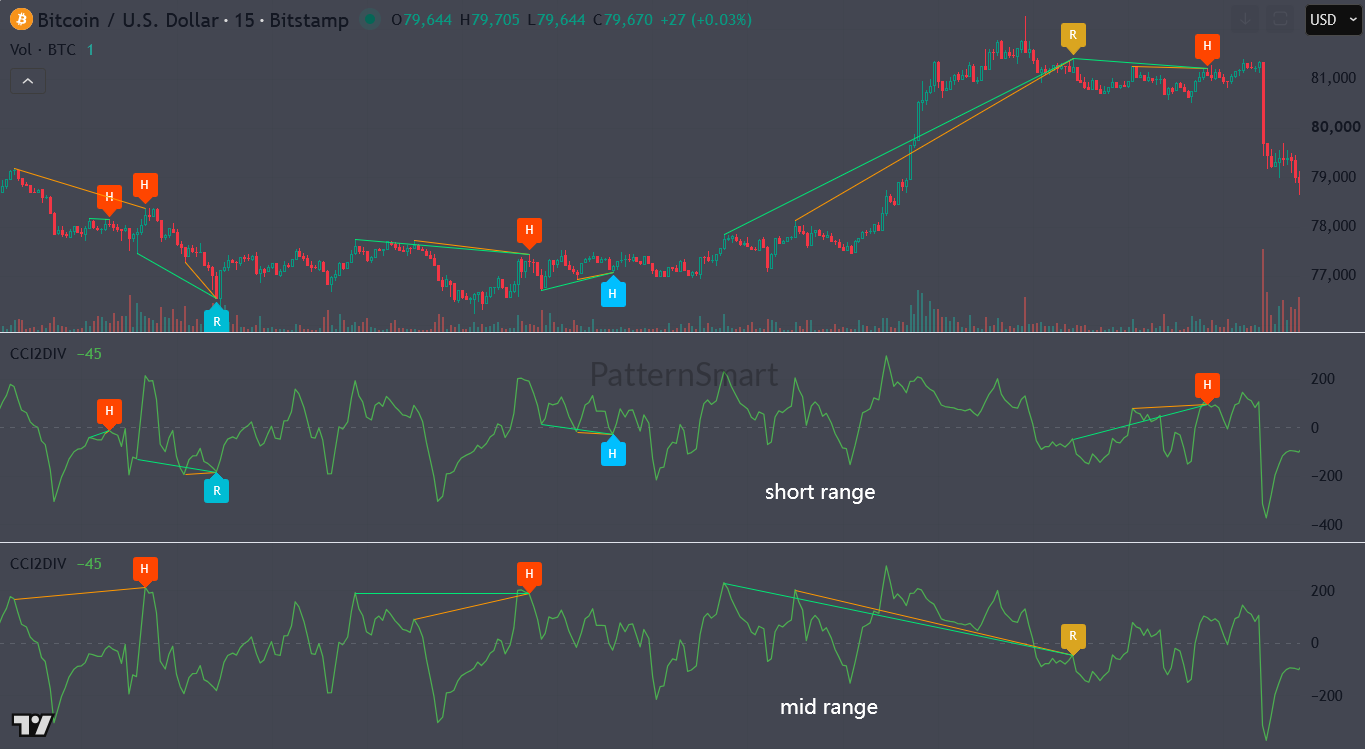
Market Overview & Trend Structure: BTCUSD
Bitcoin (BTCUSD) recently transitioned from an extended consolidation phase near $77,000 into a sharp directional expansion toward the $81,000 resistance zone.
[Price Action: Higher Highs]   --->   $77,000  --->  $79,000  --->  $81,000
[CCI Deviation: Lower Highs]   --->   +210     --->  +165     --->  +125
                                       \________________________/
                                         Bearish Regular Divergence
A technical review of the current daily chart highlights several key structural characteristics:
- Primary Trend: Constructive daily bias, trading above key exponential moving averages (EMA 20 and EMA 50).
- Key Resistance: Major overhead liquidity sitting between $81,000 and $83,300.
- Key Support: Immediate structural support established at $79,700–$80,000, with secondary demand near $77,000.
- Cyclical Extension: Following a rapid upward expansion, market velocity is exhibiting signs of short-term exhaustion as price approaches long-term supply zones.
While price action continues to print higher local highs, evaluating internal market momentum reveals a shifting statistical landscape.
The Commodity Channel Index (CCI) & Statistical Extremes
To evaluate whether this upward expansion remains healthy, traders must look beyond price alone. The Commodity Channel Index (CCI) measures price deviation relative to a statistical moving average:
$$\text{CCI} = \frac{\text{Typical Price} – \text{Simple Moving Average}}{0.015 \times \text{Mean Deviation}}$$
Because CCI fluctuates around a zero centerline—typically bounded within $\pm 100$ during balanced conditions—readings exceeding $+100$ or $+200$ signal statistically extended market movement.
When applied to BTCUSD, CCI does not simply indicate whether the asset is “overbought” or “oversold.” Instead, it highlights price deviation and mean-reversion potential. When price achieves a new high but CCI fails to reach a corresponding peak, it signals that price is extending further from its average on declining relative velocity.
Divergence Analysis on BTCUSD
Applying the PatternSmart Double Divergence methodology to BTCUSD reveals a classic divergence signature across recent daily swings.
BTCUSD Daily Chart Context
--------------------------------------------------------------------------------
Price Action:       [Swing Low] ----> [Higher Low]  (Bullish Trend Intact)
                                  vs.
CCI Indicator:      [Swing Low] ----> [Lower Low]   (Hidden Bullish Divergence)
--------------------------------------------------------------------------------
Price Action:       [Swing High] ---> [Higher High] (Price Expansion)
                                  vs.
CCI Indicator:      [Swing High] ---> [Lower High]  (Bearish Regular Divergence)
--------------------------------------------------------------------------------
1. Bearish Regular Divergence (Near Overhead Resistance)
As BTCUSD pushed from $79,000 to test $81,000, price established a clear higher high. However, the CCI indicator generated a distinctly lower peak, dropping from an extended statistical reading of $+210$ down to $+125$.
- Analytical Interpretation: This disagreement between price and momentum represents Bearish Regular Divergence. It indicates that while buyers successfully pushed spot prices higher, the rate of statistical price deviation is normalizing. The trend is losing its underlying acceleration, signaling that a period of consolidation or mean reversion toward the statistical average may be developing.
2. Bullish Hidden Divergence (During Pullback Phases)
Conversely, during minor structural pullbacks within the broader uptrend (such as the retest of $77,000), BTCUSD formed a structural higher low while CCI dropped to a lower low near $-120$.
- Analytical Interpretation: This pattern represents Bullish Hidden Divergence. It demonstrates that while the oscillator experienced a deep statistical reset, price retained its structural integrity above key support. This divergence indicates underlying trend resilience, suggesting that the broader bullish market structure remained intact despite short-term pullbacks.
Confirmation Philosophy: Evaluating the Evidence
A core principle of the PatternSmart methodology is that divergence represents information, not a guaranteed prediction. A divergence observation should never be interpreted as an automatic trade signal or an absolute reversal guarantee.
To turn divergence observations into actionable technical context on TradingView, traders should apply multi-layered confirmation:
- Price Action Confirmation: Wait for price to confirm the oscillator’s warning—such as a failure to hold $80,000 support or a clear candle close below key EMA levels—before assuming a mean-reversion move is underway.
- Structural Levels: Cross-reference CCI signals with critical horizontal zones. A Bearish Regular Divergence forming directly beneath major supply ($81,500–$83,300) carries significantly higher analytical weight than one forming in open space.
- Multi-Timeframe Alignment: Verify if shorter timeframes (e.g., 4-hour charts) are showing structural breakdown or if higher timeframes (e.g., weekly charts) remain strongly aligned with the dominant trend.
Confirmation Principle: Confirmation strengthens analytical confidence; it does not eliminate market risk. Always evaluate divergence within its broader technical context.
PatternSmart Double Divergence Pro Features on TradingView
The PatternSmart Double Divergence Pro indicator streamlines this analytical workflow directly within TradingView’s cloud-based charting platform. Designed around official product standards, key configurable features include:
- Filter Divergence by Trend: Allows traders to align divergence detection with the dominant market trend, filtering out counter-trend noise during powerful directional expansions.
- Multi-Timeframe Analysis (MTF): Enables traders to plot higher-timeframe CCI divergence directly onto lower-timeframe execution charts, ensuring multi-timeframe structural alignment.
- Flexible Signal Inputs: Customizable parameters for pivot sensitivity, confirmation rules, and evaluation periods to suit varying market volatilities.
- Native TradingView Alerts: Integrated alert conditions that notify traders in real time when confirmed Regular or Hidden Divergence events trigger across watched crypto pairs.
FAQs
What does CCI divergence indicate on BTCUSD?
CCI divergence indicates a structural disagreement between price action and price velocity relative to its statistical average. It highlights potential momentum exhaustion, mean-reversion conditions, or hidden trend continuation strength.
Is Bearish Regular Divergence a signal to short Bitcoin immediately?
No. Within the PatternSmart methodology, divergence is an analytical observation, not a standalone entry signal. It suggests momentum is slowing, but price can remain extended during strong bull market phases. Traders should wait for price action confirmation before making trading decisions.
Why choose CCI over RSI for Double Divergence analysis?
While RSI measures bounded momentum speed between 0 and 100, CCI measures unbounded statistical deviation from a moving average. CCI is exceptionally well-suited for mean-reversion strategies and identifying cyclical extremes in volatile markets like cryptocurrency.
Educational Conclusion
The PatternSmart CCI Double Divergence methodology transforms standard technical analysis into a structured, probability-based framework. By evaluating the relationship between BTCUSD price action and statistical price deviation, traders can spot momentum deceleration near key resistance zones and identify underlying structural strength during market pullbacks.
Relying on confirmation-first analysis ensures that technical indicators serve their true purpose: enhancing analytical confidence, improving risk discipline, and providing clearer insight into evolving market behavior.
Take Control of Your Chart Analysis
Elevate your technical analysis with real-time, confirmation-based tools built for modern markets.
[Explore PatternSmart Double Divergence Pro for TradingView Today]
Looking for the complete mathematical breakdown, step-by-step optimization guides, and advanced trading strategies? Explore our comprehensive documentation:
- Read the master guide on the Double Divergence Indicator Series.
- Visit the Technical Inputs Manual: Double Divergence Pro for full parameter tuning.