RSI Divergence Analysis
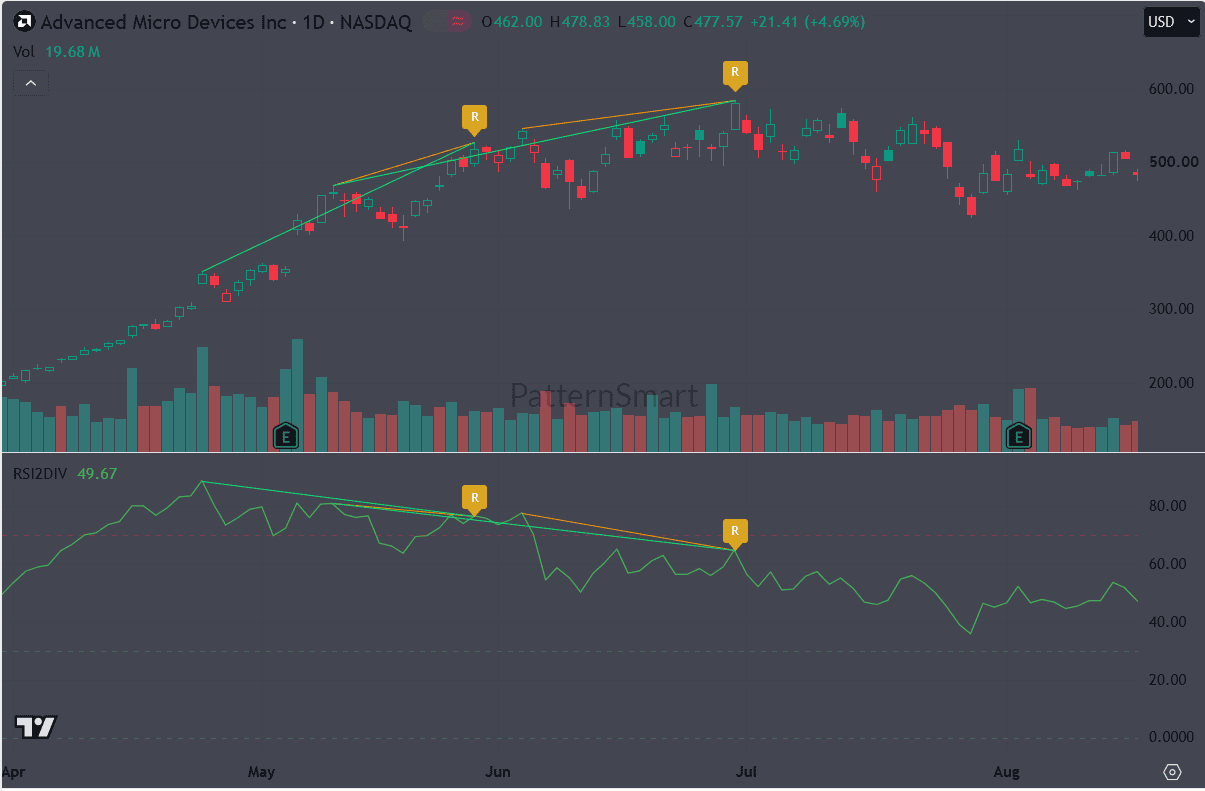
Advanced Micro Devices Inc. (NASDAQ: AMD) recently exhibited a textbook demonstration of momentum exhaustion on the daily timeframe. As tracked on TradingView, the price action across the summer months formed a prominent RSI Double Divergence (RSI2DIV), signaling strong institutional distribution near multi-month highs before a substantial price correction unfolded.
- Double Bearish Divergence Confirmation: Sequential higher price highs paired with consecutive lower indicator highs on the RSI2DIV signaled severe momentum decay near the $600 psychological resistance level.
- Volume & Structure Alignment: The failure to expand indicator momentum during the secondary price push highlighted buyer exhaustion, preceding a breakdown below the $500 support threshold.
- Educational Takeaway: Utilizing a dual-pivot divergence model provides systematic confirmation for identifying structural trend shifts and setting defined risk invalidation levels.
TradingView Daily Chart Deep Dive
As observed on the TradingView daily chart, AMD maintained an aggressive bullish trend from April through June, rallying from the $300 zone to test historic structural highs. However, an analysis of the underlying momentum using the RSI Double Divergence (RSI2DIV) indicator reveals distinct structural weakness during the final legs of the move.
Price Action:   (Peak 1: ~$550) ----[Higher High]----> (Peak 2: >$600)
                                                                 \
                                                            [Downside Correction]
                                                                 v
RSI2DIV:       (Peak 1: ~80.0) ----[Lower High]-----> (Peak 2: ~65.0)
Divergence Formation & Structural Breakdown
- First Divergence Pivot (May – June): AMD pushed sharply upward to print an initial peak near $550 (marked by the first yellow R pivot). The RSI2DIV indicator expanded into deep overbought territory near the 80.00 level, confirming strong initial momentum.
- Second Divergence Pivot (June – July): Following a brief consolidation, price rallied again to set a higher high above $600 (marked by the second yellow R pivot). However, the RSI2DIV indicator printed a lower high near the 65.00 region.
- The Double Divergence Signal: The overlapping trendlines across both price peaks and indicator peaks illustrate a Bearish Double Divergence. Two consecutive attempts by buyers to extend price higher were met with diminishing momentum intensity, pointing to active distribution by institutional participants.
- Post-Signal Resolution: Following the completion of the second R pivot in early July, buying volume dried up. AMD broke down through structural support, falling cleanly past the $500 level toward the $400–$450 demand zone, where price began establishing a local consolidation base near $477.57.
Trading Setup & Risk Management Framework
Analyzing a Double Divergence on TradingView requires integrating momentum signals with objective price structures to define clear trade parameters:
Execution Parameters
- Trigger Identification: Systematic traders avoid front-running the divergence during its formation. Confirmation occurs when price breaks the immediate structural swing low (neckline) following the print of the secondary R pivot marker.
- Invalidation Level: Invalidation is anchored directly above the secondary structural swing high (above $600). A daily candle close above this level invalidates the bearish momentum divergence hypothesis.
- Downside Price Targets:
- Target 1 (Structural Breakout Point): The primary structural support level at $500.
- Target 2 (Major Demand Pool): The secondary liquidity and balance zone between $400 and $450.
The RSI Double Divergence Pro indicator is available in these platforms: Ctrader, MetaTrader(MT4, MT5), NinjaTrader 8, MultiCharts, MultiCharts x.NET, Tradingview(subchart only), Prorealtime(subchart only), SierraChart.
Read the master guide on the Double Divergence Indicator Series.
Visit the Technical Inputs Manual: Double Divergence Pro for full parameter tuning.
Access our full suite of technical analysis and research articles on the RSI Double Divergence Indicator here.