Market Overview
The attached chart presents BTCUSD on the 1-Day timeframe, using Bitstamp data and the CCI Double Divergence indicator in TradingView. The most recent candle is shown around 79,544, with an intraday high near 79,738 and low near 79,500. The latest daily candle is slightly negative, down approximately 0.17%.
The broader price structure visible on the chart can be divided into several distinct phases.
Initially, BTCUSD experienced a pronounced decline, followed by a period of stabilization near the lower portion of the chart. Price then began recovering and developed a series of higher short-term swings. This recovery eventually transitioned into a sideways consolidation.
The important feature of this consolidation is that price did not immediately collapse after the earlier advance. Instead, the market repeatedly moved within a relatively contained range while the CCI continued to change.
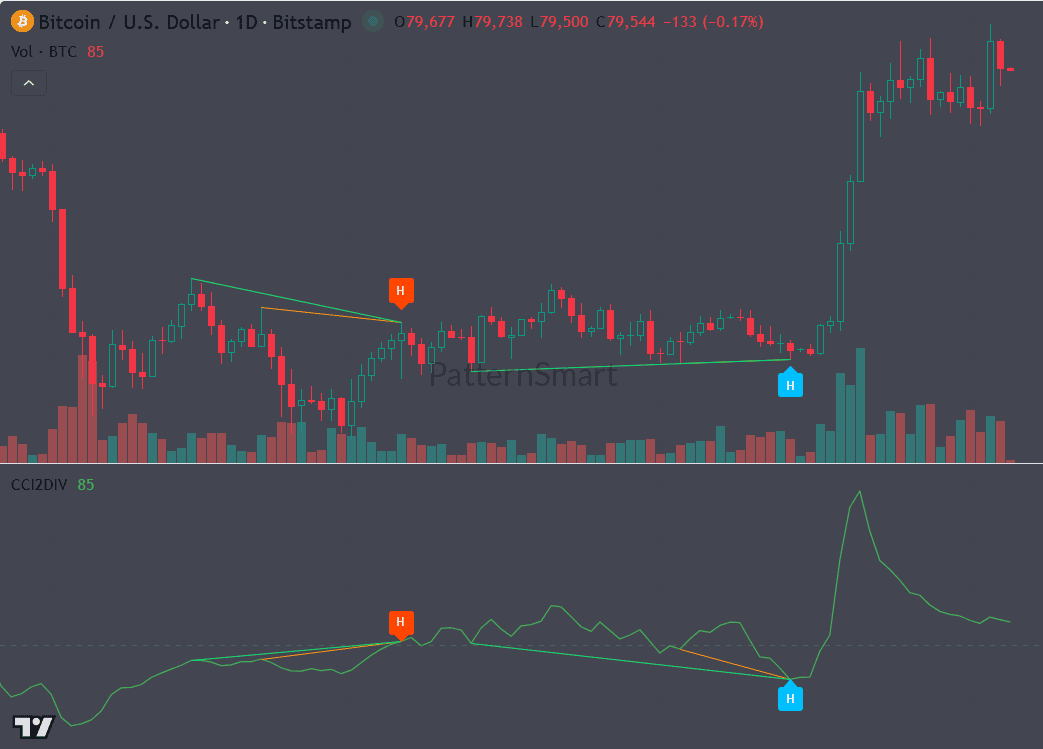
Two H-labeled Double Divergence signals appear during this structural development. Both are Hidden Divergence signals, but they occur in opposite directions and provide different information about the developing market structure.
The first is Bearish Hidden Divergence, while the second is Bullish Hidden Divergence.
The subsequent price action makes this chart particularly useful for understanding why Hidden Divergence should be interpreted in the context of market structure rather than treated as an isolated signal. PatternSmart’s methodology specifically emphasizes context, confirmation, and probability rather than prediction.
Why CCI Adds a Different Perspective
The Commodity Channel Index evaluates price deviation from its statistical average and can also reveal changes in momentum, market expansion, contraction, and cyclical behavior. Because CCI is responsive to changes in price deviation, it can provide information about whether an existing price movement is maintaining or losing its previous characteristics.
This is important on the current chart because the signals are not simply asking whether BTCUSD is rising or falling. They are comparing the shape of price swings with the corresponding behavior of CCI.
That comparison produces the two Hidden Divergence observations.
Signal 1: Bearish Hidden Divergence
The first orange H appears during the recovery phase after the earlier decline.
Price structure
The price swing associated with the signal forms a lower high relative to the preceding significant high.
The green line drawn across the price chart slopes downward, visually connecting the earlier high with the later lower high.
CCI structure
At the same time, CCI forms a higher high between the corresponding swing points.
The indicator therefore moves in the opposite structural direction from price:
- Price: Lower High
- CCI: Higher High
This is the defining structure of Bearish Hidden Divergence. Under the PatternSmart methodology, Bearish Hidden Divergence can indicate that bearish conditions remain technically consistent despite a temporary upward price movement. It is commonly associated with pullbacks and continuation rather than being treated simply as a reversal signal.
What the signal means in this chart
The important observation is that the recovery into the signal did not establish a stronger price high. Instead, price stalled below the earlier swing high.
Meanwhile, CCI moved higher.
Because CCI measures price deviation and related momentum characteristics, this difference suggests that the temporary upward movement had developed a different internal structure from the preceding price swing.
The signal therefore provided bearish continuation information rather than simply saying that BTCUSD was “overbought.”
Confirmation After the First Signal
The subsequent price action provides important confirmation.
After the Bearish Hidden Divergence appeared, BTCUSD moved lower and eventually produced a much deeper decline. Price returned toward the lower portion of the developing range before beginning another recovery.
This is exactly why the PatternSmart methodology places confirmation ahead of prediction. The divergence itself was an analytical observation; the subsequent bearish price movement provided additional evidence that the interpretation of the structure was meaningful. Confirmation strengthens analytical confidence but does not constitute certainty.
In other words, the signal should not be described as having predicted the decline. The chart instead shows that the bearish interpretation was followed by substantial bearish price development.
Signal 2: Bullish Hidden Divergence
The second signal appears later, near the lower portion of the consolidation.
This signal is particularly important because the market structure has changed considerably by this point.
Price structure
Price forms a higher low relative to the previous significant low.
The second price trough therefore remains above the earlier trough.
CCI structure
CCI simultaneously forms a lower low.
The relationship is:
- Price: Higher Low
- CCI: Lower Low
This is the defining structure of Bullish Hidden Divergence. PatternSmart’s methodology interprets this structure as potential evidence that bullish conditions remain supported despite temporary price weakness. Hidden Divergence is therefore particularly relevant when analyzing pullbacks within an emerging bullish structure.
Why this signal is significant
The price chart shows that the second decline did not return to the previous low.
That distinction matters.
Although CCI moved to a lower low, price successfully held at a higher structural level. The market therefore demonstrated greater price resilience than the preceding decline.
From a CCI perspective, this creates an interesting contrast: CCI showed greater downside deviation, while price maintained a higher structural low.
The signal therefore suggests that the corrective weakness should be examined as a potential normalization or reset within the broader developing structure, rather than automatically interpreted as a breakdown.
Confirmation After the Bullish Hidden Divergence
The price action following the second H-labeled signal provides particularly clear confirmation.
BTCUSD first moved sideways and then began advancing strongly. The advance eventually accelerated into a substantial upside breakout.
The chart shows:
Bullish Hidden Divergence → recovery → consolidation → strong upside expansion
The later breakout is therefore consistent with the continuation interpretation of the Bullish Hidden Divergence.
Again, this does not mean the divergence guaranteed the breakout. The methodology requires the analyst to treat the signal as technical evidence and then evaluate the subsequent price action and market structure.
The important educational point is that the second signal occurred before the most significant upside movement visible on the chart. Its value lies in identifying a potentially meaningful structural relationship while the market was still developing.
The Market Context After the Signals
The right side of the chart shows a dramatic change in market character.
Following the Bullish Hidden Divergence, BTCUSD eventually breaks upward from the preceding consolidation and moves sharply higher.
Several large bullish candles appear during this expansion, accompanied by visibly larger volume bars than many of the preceding consolidation candles.
Price then reaches the upper portion of the visible chart and begins moving sideways again.
The current structure is therefore different from the environment in which the two Hidden Divergence signals appeared.
The market has transitioned from:
Decline → stabilization → recovery → consolidation → upside expansion → high-level consolidation
This progression is important because divergence should always be interpreted according to the market environment in which it occurs.
What CCI Is Showing Now
The CCI panel provides another useful observation.
During the upside expansion, CCI rises sharply and reaches its highest visible level on the chart. After that peak, CCI declines gradually.
However, on the latest bars, CCI remains above the central dashed reference area.
This means the current chart shows CCI normalization after a strong expansion, but it does not show another confirmed Double Divergence signal.
That distinction is important.
A declining CCI value by itself should not be interpreted as a bearish signal. CCI can normalize after a strong price expansion without implying that price must reverse. The CCI knowledge base specifically cautions that extreme indicator values or changing CCI behavior do not automatically mean an immediate reversal.
Understanding the Two Signals Together
The most educational aspect of this chart is the sequence of the two Hidden Divergence observations.
First signal
Bearish Hidden Divergence
Price → Lower High
CCI → Higher High
The subsequent decline showed bearish follow-through.
Second signal
Bullish Hidden Divergence
Price → Higher Low
CCI → Lower Low
The subsequent recovery and eventual upside expansion showed bullish follow-through.
This sequence illustrates an important principle of Double Divergence analysis: the same indicator can provide different information as market structure changes.
The first signal occurred during a recovery that failed to establish a stronger price high.
The second occurred during a decline that failed to establish a lower price low.
The signals therefore need to be interpreted relative to the structure surrounding them rather than judged independently.
Confirmation Is More Important Than the Label
A common mistake when studying divergence is to focus entirely on whether a signal is bullish or bearish.
A more useful analytical process is:
- Identify the price structure.
- Compare the corresponding CCI structure.
- Classify the divergence.
- Examine the broader market context.
- Observe subsequent price behavior.
- Look for additional technical confirmation.
PatternSmart’s methodology explicitly treats divergence as information rather than prediction. Price action remains the primary source of information, while the indicator provides an additional analytical perspective.
This chart demonstrates why that distinction matters.
Both signals became much more informative when viewed alongside the price structure that followed them.
Conclusion
The BTCUSD daily chart provides a clear example of how CCI Double Divergence can be used to study changes in market structure rather than simply search for reversal signals.
The first Bearish Hidden Divergence developed when price established a lower high while CCI established a higher high. The subsequent decline provided bearish follow-through.
The second Bullish Hidden Divergence developed when price established a higher low while CCI established a lower low. The subsequent recovery and eventual upside expansion provided strong chart-based confirmation of the bullish continuation interpretation.
The current market is visibly different from both signal environments. BTCUSD has undergone a powerful upside expansion and is now consolidating near the upper portion of the visible range, while CCI has retreated from its peak but remains elevated relative to the earlier structure.
The broader lesson is not that either divergence “predicted” what happened next. Rather, the chart demonstrates the core PatternSmart principle: divergence provides evidence, market structure provides context, and subsequent price action provides confirmation.
That confirmation-based approach is particularly important with CCI because its responsiveness to price deviation can reveal changing conditions early, while also making context essential when interpreting the resulting observations.