Identify RVI Divergence with Greater Clarity and Confidence
RVI Double Divergence Pro for TradingView is a professional technical-analysis indicator designed to help traders identify Regular and Hidden Bullish and Bearish divergences directly on their TradingView charts.
By combining an RVI-based momentum view with advanced divergence visualization, configurable detection ranges, signal filtering, and chart-based markers, RVI Double Divergence Pro gives traders a cleaner way to monitor potential momentum shifts and continuation opportunities.
Whether you trade stocks, forex, cryptocurrencies, indices, or futures, this indicator helps turn complex divergence analysis into an easy-to-read visual workflow.
Spot divergence. Understand momentum. Trade with a clearer chart.
What Is RVI Double Divergence Pro?
RVI Double Divergence Pro is a TradingView indicator built around the Relative Vigor Index (RVI) and designed specifically for divergence analysis.
Instead of relying on a single divergence comparison, the indicator evaluates relationships across multiple relevant price and momentum reference points to identify potential divergence structures.
The result is a visual divergence system that can highlight:
- Regular Bullish Divergence
- Hidden Bullish Divergence
- Regular Bearish Divergence
- Hidden Bearish Divergence
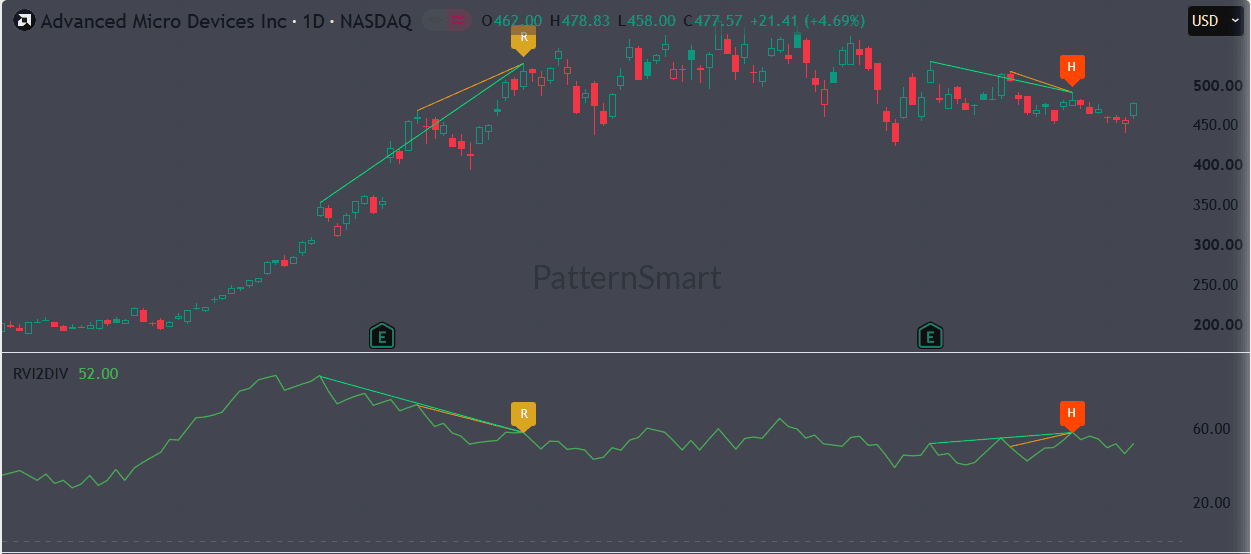
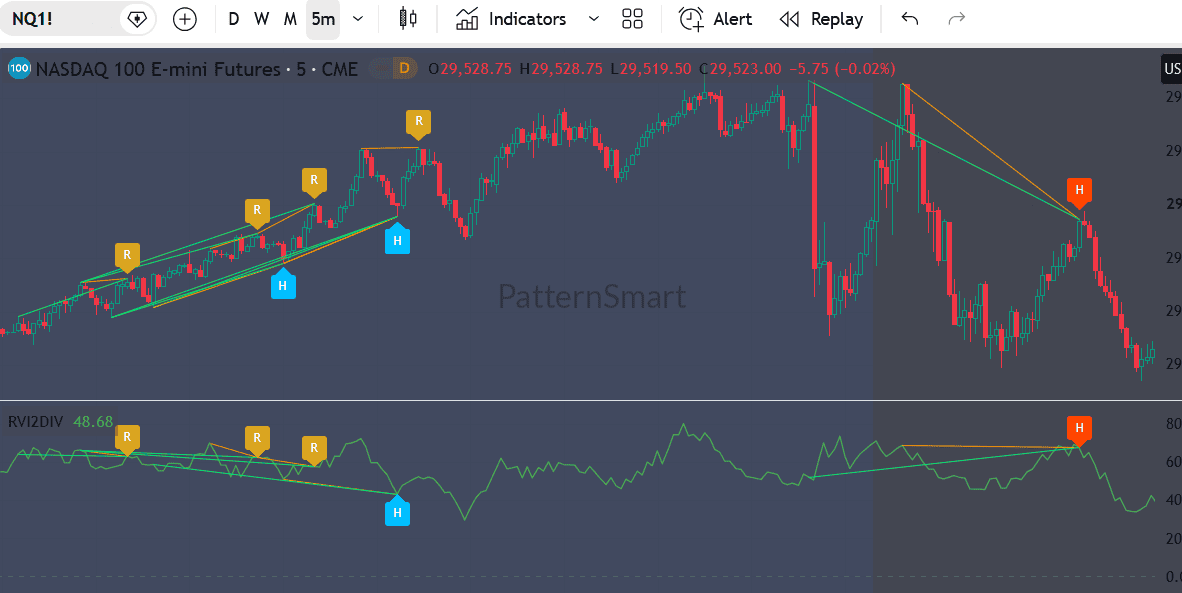
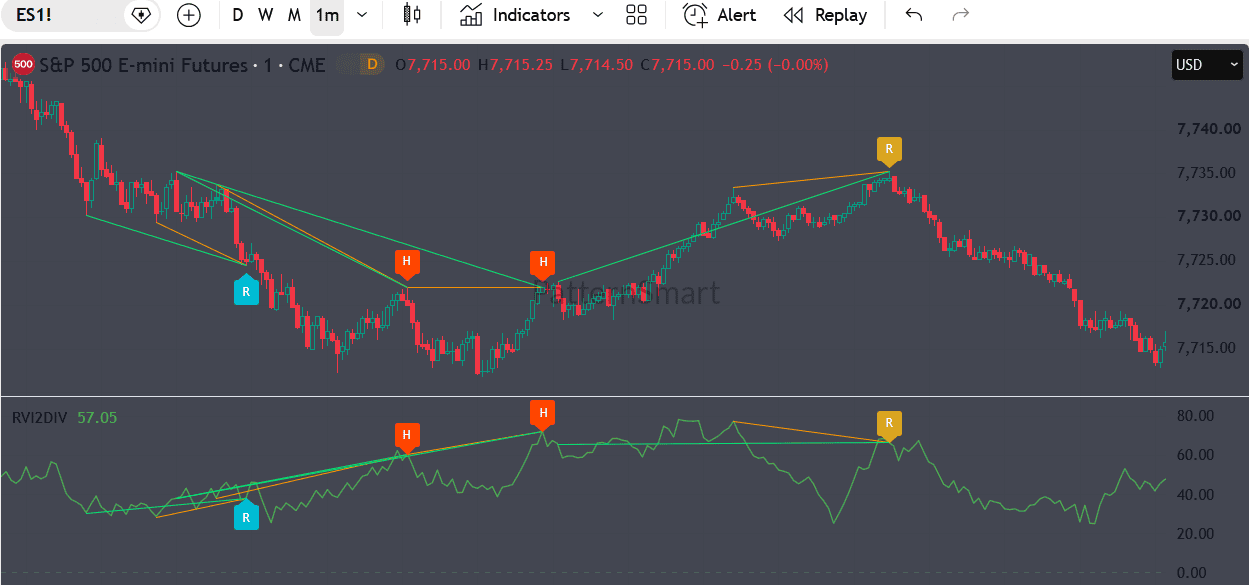
The indicator displays these signals in the momentum pane while also providing corresponding markers and lines directly on the price chart, making it easier to connect momentum behavior with actual market structure.
Key Features
1. Four Types of RVI Divergence
RVI Double Divergence Pro supports the four major divergence categories traders commonly monitor.
Regular Bullish Divergence
Designed to highlight situations where price and momentum develop conflicting downside behavior that may indicate weakening bearish pressure and a potential bullish reversal.
Hidden Bullish Divergence
Helps identify potential bullish continuation conditions where price structure and momentum show a hidden divergence relationship.
Regular Bearish Divergence
Highlights potential bearish reversal conditions when price and momentum exhibit opposing behavior near important highs.
Hidden Bearish Divergence
Helps traders monitor potential bearish continuation setups through hidden divergence relationships.
You can independently enable or disable each divergence type according to your trading style.
2. RVI Momentum Analysis
The indicator includes an RVI momentum plot in a dedicated TradingView pane, allowing you to view divergence signals alongside the underlying momentum behavior.
The RVI calculation uses a configurable RVI Length, giving traders control over the sensitivity of the momentum analysis.
This makes the indicator suitable for different market conditions and trading timeframes.
3. Flexible Divergence Range Settings
Different traders look for divergence over different distances.
RVI Double Divergence Pro provides three divergence range options:
- Short Range
- Mid Range
- Long Range
You can also adjust the divergence lookback and filtering parameters to better match your preferred trading style.
This flexibility allows the indicator to be adapted for faster setups as well as broader market structures.
4. Enhanced Mode
For traders who want a more selective signal experience, RVI Double Divergence Pro includes an Enhanced Mode.
Enhanced Mode can be enabled or disabled from the indicator settings, allowing you to choose between a broader divergence-monitoring approach and a more selective presentation.
5. Clean Divergence Lines
Visual confirmation is one of the most important parts of divergence analysis.
RVI Double Divergence Pro can draw divergence lines in the momentum pane and corresponding price-based lines on the chart.
This makes it easier to visually compare:
Price Structure ↔ RVI Momentum
You can also control whether divergence lines are displayed and adjust their width and colors to suit your chart layout.
6. Price-Chart R/H Markers
The indicator doesn’t force you to constantly switch between the price chart and oscillator pane.
When a divergence is detected, corresponding R/H markers can appear on the price chart:
- R = Regular Divergence
- H = Hidden Divergence
Bullish markers appear below the relevant price area, while bearish markers appear above it, providing an immediate visual reference.
The source implementation also supports price-panel divergence lines and markers.
7. Signal Confirmation Option
RVI Double Divergence Pro includes an optional Wait 1 Bar confirmation setting.
When enabled, the indicator waits for an additional candle confirmation before presenting the corresponding bullish or bearish signal.
This gives traders the flexibility to choose between:
Earlier signal recognition
or
Additional confirmation
depending on their trading methodology.
8. Reduce Chart Clutter
Too many historical divergence signals can make a chart difficult to read.
RVI Double Divergence Pro includes an option to control how closely spaced signals of the same type are displayed.
The Only Show Last Same-Type Signal Within Bars setting helps reduce unnecessary visual duplication and keeps the chart cleaner.
Designed for a Cleaner TradingView Workflow
A major advantage of RVI Double Divergence Pro is that divergence information is presented in two complementary locations.
Momentum Pane
View:
- RVI momentum
- Divergence lines
- Regular/Hidden labels
- Bullish/Bearish signal relationships
Price Chart
View:
- Bullish and bearish R/H markers
- Price divergence lines
- Signal locations relative to actual candles
This dual-view approach makes it easier to connect oscillator behavior with price action without manually drawing every divergence yourself.
Customizable for Your Trading Style
RVI Double Divergence Pro provides a range of user-configurable settings, including:
| Setting | Purpose |
|---|---|
| RVI Length | Adjusts the RVI momentum period |
| Divergence Bar Range | Selects Short, Mid, or Long range analysis |
| Divergence Lookback | Controls the divergence analysis window |
| Filter Length | Adjusts momentum filtering |
| Swing Search Bars | Controls the historical search area |
| Wait 1 Bar | Enables additional signal confirmation |
| Regular Bullish | Show/hide regular bullish signals |
| Hidden Bullish | Show/hide hidden bullish signals |
| Regular Bearish | Show/hide regular bearish signals |
| Hidden Bearish | Show/hide hidden bearish signals |
| Enhanced Mode | Enables enhanced signal filtering |
| Show Divergence Lines | Controls visual divergence lines |
| Show R/H Labels | Controls signal labels |
| Signal Display Filter | Helps manage repeated signals |
| Line Width & Colors | Personalize chart appearance |
These controls are directly reflected in the indicator’s configurable inputs.
Automatic Alerts
You don’t have to watch your TradingView chart continuously.
RVI Double Divergence Pro includes alert conditions for all four supported divergence categories:
- Regular Bullish Divergence
- Hidden Bullish Divergence
- Regular Bearish Divergence
- Hidden Bearish Divergence
This allows traders to integrate divergence monitoring into their TradingView alert workflow.
Why Use RVI Double Divergence Pro?
Save Time on Manual Divergence Analysis
Manually searching for divergence requires constantly comparing price highs/lows against oscillator highs/lows.
RVI Double Divergence Pro automates the visual identification process so you can spend more time analyzing the market and less time drawing lines.
See the Signal Where It Matters
Signals aren’t confined to an oscillator window. Corresponding markers and price lines can be displayed directly on the price chart.
Separate Reversal and Continuation Signals
Regular and hidden divergences represent different types of market situations. Having both available in one indicator helps traders distinguish potential reversal opportunities from continuation-oriented setups.
Adapt the Indicator to Your Strategy
With adjustable range, lookback, filtering, confirmation, display, and visual settings, the indicator can be configured around different trading approaches.
How to Use RVI Double Divergence Pro
Step 1 — Add the Indicator to Your TradingView Chart
Apply RVI Double Divergence Pro to the market and timeframe you want to analyze.
Step 2 — Select Your Divergence Range
Choose between:
- Short Range
- Mid Range
- Long Range
based on how broadly you want to monitor divergence structures.
Step 3 — Configure Signal Types
Enable the divergence categories relevant to your strategy.
You can independently display regular and hidden bullish or bearish signals.
Step 4 — Adjust Confirmation and Filtering
Fine-tune the available settings such as RVI length, lookback, filtering, and optional one-bar confirmation.
Step 5 — Monitor the Chart
Watch for the R/H markers, divergence lines, and RVI momentum behavior.
Use the signals as part of your broader technical-analysis process rather than as standalone buy or sell instructions.
Step 6 — Set TradingView Alerts
Configure alerts for the divergence conditions you want to monitor so you can be notified when relevant signals occur.
Built for Multiple Trading Styles
RVI Double Divergence Pro can be useful for traders who incorporate divergence into:
- Forex trading
- Cryptocurrency trading
- Stock trading
- Index trading
- Futures trading
- Swing trading
- Intraday trading
- Technical analysis
- Momentum analysis
- Price-action analysis
Because the indicator provides configurable range and sensitivity settings, traders can experiment with configurations appropriate for their preferred markets and timeframes.
RVI Divergence Made Visual
Divergence can be powerful—but only when it can be interpreted quickly.
RVI Double Divergence Pro transforms divergence analysis into an organized visual system:
RVI Momentum → Divergence Detection → Visual Lines → R/H Markers → TradingView Alerts
The goal is simple: make potentially important price-versus-momentum relationships easier to recognize without covering your chart with manual drawings.
Important: Use Signals as Part of a Complete Trading Strategy
RVI Double Divergence Pro is a technical-analysis and charting tool. Divergence signals do not guarantee a market reversal, continuation, or profitable trade.
Market conditions can change rapidly, and signals should be evaluated alongside factors such as:
- Price action
- Market structure
- Trend direction
- Support and resistance
- Volatility
- Volume
- Risk management
- Position sizing
- Your own trading plan
Always perform your own analysis before entering a trade.
Frequently Asked Questions
What is RVI Double Divergence Pro?
RVI Double Divergence Pro is a TradingView technical-analysis indicator designed to identify and visually display regular and hidden bullish and bearish divergences using an RVI-based momentum analysis.
What types of divergence does it detect?
It supports four categories:
- Regular Bullish
- Hidden Bullish
- Regular Bearish
- Hidden Bearish
Can I customize the indicator?
Yes. The source includes settings for RVI length, divergence range, lookback, filtering, swing search, confirmation, signal visibility, enhanced mode, labels, lines, colors, and other display controls.
Does it show divergence directly on the price chart?
Yes. The indicator can display corresponding bullish and bearish markers and price-based divergence lines directly on the chart.
Does RVI Double Divergence Pro support alerts?
Yes. Alert conditions are provided for all four divergence categories.
Can I turn individual divergence types on or off?
Yes. Regular bullish, hidden bullish, regular bearish, and hidden bearish signals each have independent display controls.
Is RVI Double Divergence Pro a buy/sell system?
No. It is a technical-analysis tool designed to help traders identify divergence and momentum relationships. It should be used together with a complete trading strategy and appropriate risk management.
Take Your Divergence Analysis to the Next Level
Stop manually searching through every swing and comparing price movement against momentum.
RVI Double Divergence Pro for TradingView gives you a dedicated visual framework for monitoring regular and hidden divergence, displaying signals on both the momentum pane and price chart, customizing signal behavior, and creating TradingView alerts.
See More. Analyze Faster. Trade Smarter.
Add RVI Double Divergence Pro to your TradingView toolkit today.
Looking for the complete mathematical breakdown, step-by-step optimization guides, and advanced trading strategies? Explore our comprehensive documentation:
Visit the Technical Inputs Manual: Double Divergence Pro for full parameter tuning.
Read the master guide on the Double Divergence Indicator Series.