Understand Directional Movement and Changing Market Control
DMI Double Divergence Pro for Sierra Chart combines the Directional Movement Index (DMI) with the PatternSmart Double Divergence methodology to help traders study directional pressure, trend quality, and changes in market control.
DMI provides a different perspective from indicators that focus primarily on momentum or overbought and oversold conditions. It examines directional movement by comparing positive and negative directional pressure.
When price continues moving in one direction but DMI begins showing less agreement with that movement, the difference may provide useful information about changing market conditions.
Double Divergence adds a confirmation-based framework to this analysis, helping traders evaluate whether weakening directional pressure develops through multiple stages rather than reacting to one isolated observation.
The goal is not to predict the market. It is to provide additional technical evidence that can help traders better understand what is happening on the chart.
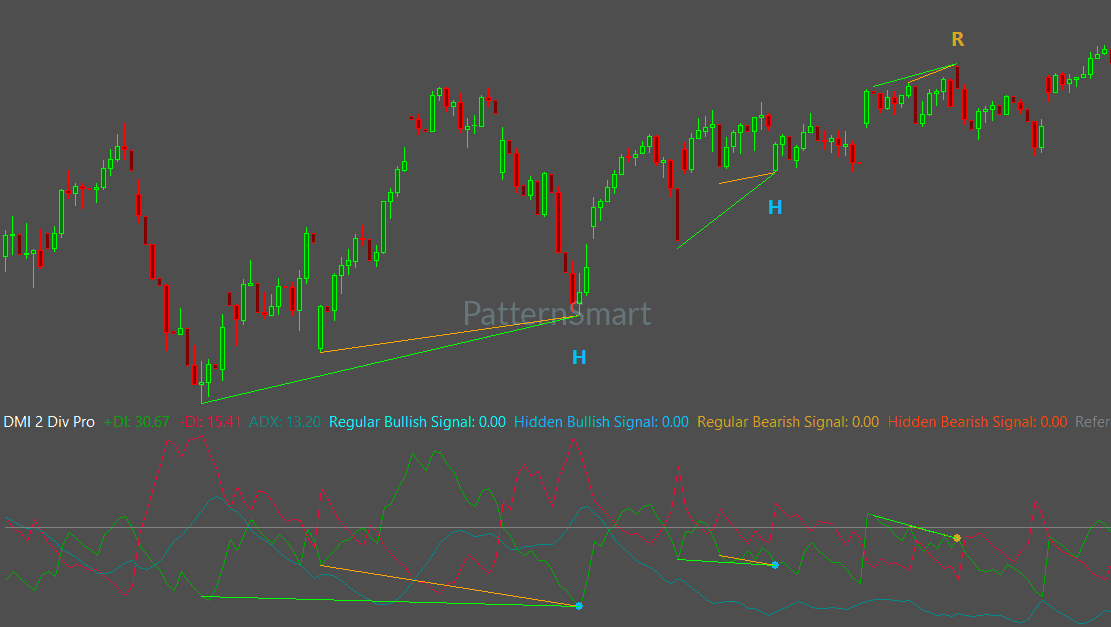
What Is DMI?
DMI stands for Directional Movement Index.
DMI is designed to evaluate the direction of market movement by comparing two primary components:
- Positive Directional Indicator (+DI)
- Negative Directional Indicator (-DI)
These two components provide information about the relative directional pressure of buyers and sellers.
In simple terms:
+DI represents positive directional movement.
-DI represents negative directional movement.
When positive directional movement is dominant, the market is showing greater bullish directional pressure. When negative directional movement is dominant, bearish directional pressure is more prominent.
This makes DMI useful for studying who is currently controlling directional movement.
That is an important distinction.
DMI is not simply asking whether price is moving quickly. It is helping traders examine the balance between upward and downward directional movement.
DMI vs. ADX: What Is the Difference?
DMI and ADX are closely related, but they answer different analytical questions.
DMI focuses on directional dominance—whether positive or negative directional movement is stronger.
ADX focuses on the overall strength of a trend without identifying its direction.
For example, ADX can indicate that a market has a strong trend, but DMI can provide additional information about whether positive or negative directional movement is currently dominant.
This makes DMI particularly useful when the objective is to study directional bias, trend quality, and changing market leadership.
What Is Divergence?
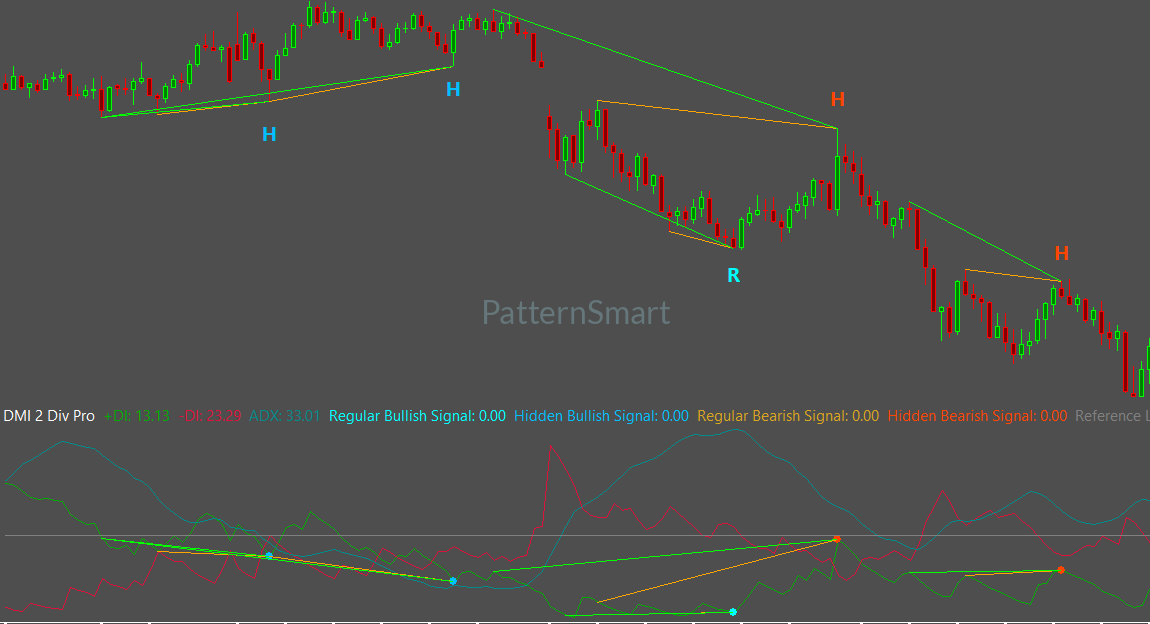
Divergence occurs when price and an indicator stop moving in agreement.
For example, suppose price continues making higher highs, but the indicator makes lower highs. Price is still advancing, but the indicator is no longer confirming the full strength of that movement.
The opposite can happen when price makes lower lows while the indicator forms higher lows.
Divergence is therefore an observation, not a prediction.
It tells you that price and the selected indicator are providing different information. The next step is to determine whether that difference is meaningful within the current market context.
What Is Double Divergence?
Traditional divergence can identify an important difference between price and an indicator. However, a single divergence observation does not necessarily mean that a trend is about to reverse.
Markets can continue trending after divergence appears.
The PatternSmart Double Divergence methodology emphasizes confirmation. It evaluates whether the changing relationship between price and the indicator develops through additional stages before a signal is confirmed.
For DMI, this means examining whether directional dominance is progressively weakening while price continues in its existing direction.
The focus is therefore not simply on finding divergence. It is on evaluating whether the divergence contributes meaningful evidence about changing market control.
Understanding the Four DMI Divergence Types
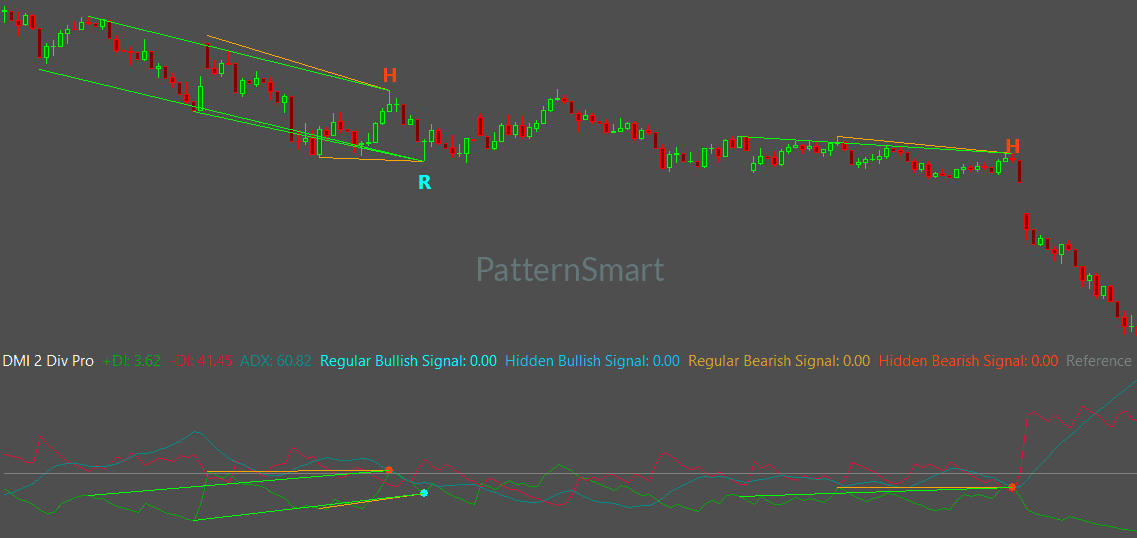
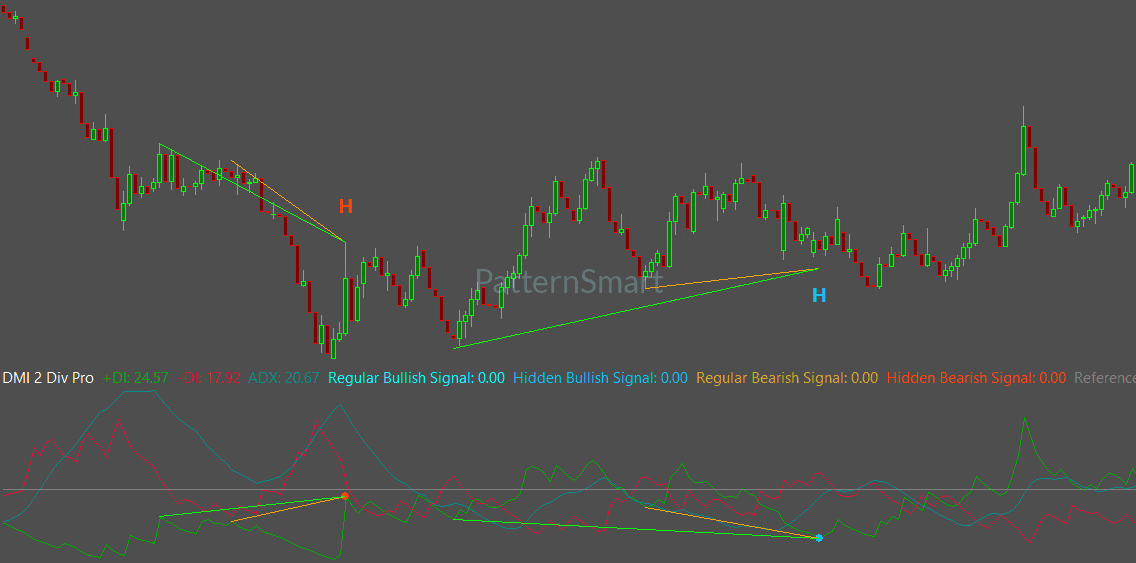
DMI Double Divergence recognizes four official signal categories.
Bullish Regular Divergence
A Bullish Regular Divergence occurs when:
Price → Lower Low
DMI → Higher Low
Price is continuing downward, but DMI is no longer confirming the full strength of the downward movement.
For DMI, this may suggest that bearish directional control is weakening.
It does not guarantee a bullish reversal. Price structure and additional confirmation remain important.
Bearish Regular Divergence
A Bearish Regular Divergence occurs when:
Price → Higher High
DMI → Lower High
Price continues upward, but DMI shows less directional agreement.
This may indicate that bullish directional conviction is beginning to weaken and that the market deserves closer examination.
Bullish Hidden Divergence
A Bullish Hidden Divergence occurs when:
Price → Higher Low
DMI → Lower Low
This type of divergence is generally associated with an established bullish market that is experiencing a temporary correction.
It may provide evidence that the broader bullish condition remains supported despite temporary weakness.
Bearish Hidden Divergence
A Bearish Hidden Divergence occurs when:
Price → Lower High
DMI → Higher High
This can be relevant when an established bearish market experiences a temporary upward correction.
The observation may suggest that bearish conditions remain technically consistent despite the temporary price movement.
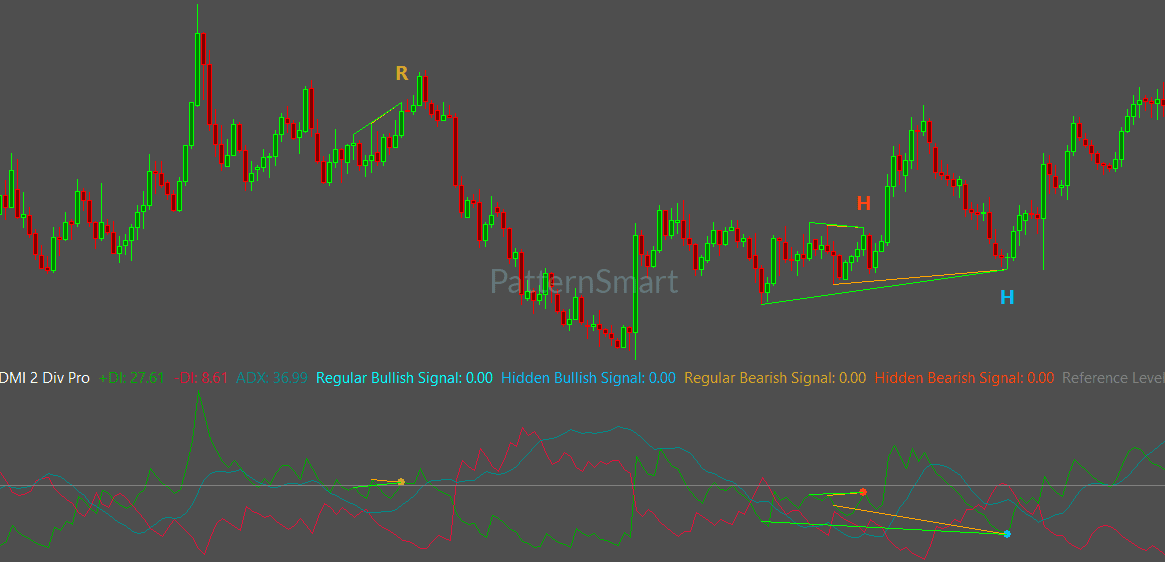
Why Confirmation Matters
A DMI divergence should not automatically become a trading decision.
PatternSmart uses a confirmation-first philosophy.
A practical way to understand this is:
Observe → Evaluate → Confirm → Interpret
First, observe what price and DMI are doing.
Next, evaluate the market context. Consider the prevailing trend, market structure, support and resistance, and other relevant technical evidence.
Then evaluate whether Double Divergence confirmation develops.
Finally, interpret the signal as part of the complete technical picture.
Confirmation can strengthen analytical confidence, but it does not create certainty.
Where DMI Double Divergence Can Be Useful
DMI Double Divergence is particularly suited to markets where directional movement is important.
The DMI knowledge base identifies the following environments as particularly relevant:
- Trending markets
- Breakout environments
- Directional markets
It can be useful for traders studying:
- Trend following
- Breakout analysis
- Position trading
- Trend continuation
- Trend quality
- Directional bias
DMI is less informative when the market is moving sideways and directional pressure is limited. Price action and broader market context therefore remain important.
DMI Double Divergence Pro Features
The Pro version provides configurable controls for signal generation, confirmation, structural evaluation, alerts, and chart presentation.
Signal Selection
You can control the display of:
- Show Regular Bullish
- Show Regular Bearish
- Show Hidden Bullish
- Show Hidden Bearish
This allows you to focus your chart on the types of divergence relevant to your analysis.
Wait 1 Bar
Wait 1 Bar determines whether the indicator waits for one completed confirmation bar before finalizing a detected signal.
When enabled, confirmation occurs after the next bar has completely closed. This provides an additional confirmation stage.
Enhanced Mode
Enhanced Mode applies additional structural validation to eligible signals.
For beginners, it can be understood as an additional filtering stage designed to require stronger structural conditions before a signal is confirmed.
Advanced Parameters
Three advanced parameters help control how divergence structures are evaluated:
Divergence Bar Range defines the structural search boundaries.
Divergence Lookback controls how historical bars are evaluated when identifying swing highs and swing lows.
Filter Length controls the internal smoothing used during structural evaluation.
These settings influence how structures are evaluated. They do not change the underlying Double Divergence methodology.
Alerts
Enable Alert allows notifications after a signal has been confirmed.
Alert Sound defines the notification sound.
Alerts are separate from signal calculation. They notify you after the analytical process has produced a confirmed signal.
Chart Visualization
DMI Double Divergence Pro also includes:
- Show Char for signal labels
- Show Line for divergence lines
- Only Show Last Signal Within Bars for reducing nearby historical chart clutter
- Price Line Brush
- Price Line Dash Style
- Price Line Width
These settings control presentation and chart readability rather than changing the underlying calculations.
Built for Sierra Chart
Sierra Chart is positioned within the PatternSmart platform knowledge base as a high-performance charting environment with an emphasis on speed, efficiency, and precision.
For traders using Sierra Chart, DMI Double Divergence provides a structured way to incorporate directional-movement analysis into an existing technical-analysis workflow.
The platform changes the working environment, but it does not change the Double Divergence methodology.
The same signal classifications and confirmation principles apply across PatternSmart-supported platforms.
A Simple Beginner Workflow
If you are new to DMI Double Divergence, start with these steps:
1. Look at price first.
Identify whether the market is trending upward, trending downward, breaking out, or moving sideways.
2. Examine +DI and -DI.
Consider which side currently has greater directional influence.
3. Compare price with DMI.
Look for situations where price continues making new highs or lows while DMI provides less confirmation.
4. Identify the divergence category.
Determine whether the observation is Bullish Regular, Bearish Regular, Bullish Hidden, or Bearish Hidden Divergence.
5. Look for confirmation.
Examine price structure, support and resistance, trend conditions, and other relevant evidence.
6. Form your interpretation.
Use the DMI Double Divergence signal as one piece of technical evidence rather than treating it as an automatic trading instruction.
Frequently Asked Questions
Is DMI a momentum indicator?
DMI is primarily a directional movement indicator. Its main purpose is to evaluate positive and negative directional movement rather than simply measuring momentum.
Does DMI Double Divergence predict reversals?
No. A divergence signal provides additional analytical evidence. It may indicate weakening directional control, but future price movement remains uncertain.
What is the difference between DMI and ADX?
DMI evaluates directional dominance through +DI and -DI. ADX measures overall trend strength without identifying the trend direction.
Is DMI Double Divergence useful for trend trading?
Yes. The DMI knowledge base identifies trend following, breakout trading, and position trading among suitable applications.
What should beginners focus on first?
Start with the relationship between price and directional movement. Learn to recognize the four divergence categories before spending significant time adjusting advanced parameters.
Do the settings change the Double Divergence methodology?
No. Settings affect software behavior, such as structural evaluation, confirmation, filtering, alerts, and visualization. They do not change the underlying methodology.
Conclusion
DMI offers a useful perspective on directional movement, trend quality, directional bias, and changing market control.
When combined with the PatternSmart Double Divergence methodology, it provides a structured way to examine situations where price continues moving in one direction while directional pressure begins to weaken.
The most important lesson for beginners is simple:
Start with price. Understand directional movement. Compare price with DMI. Identify the type of divergence. Then seek confirmation within the broader market context.
DMI Double Divergence Pro for Sierra Chart is designed to support this process by bringing structured divergence analysis, configurable confirmation and filtering controls, alerts, and chart visualization into a high-performance Sierra Chart workflow.
It is a decision-support and technical-analysis tool—not a replacement for independent analysis, risk management, or trading judgment.
Explore DMI Double Divergence Pro for Sierra Chart
Looking for the complete mathematical breakdown, step-by-step optimization guides, and advanced trading strategies? Explore our comprehensive documentation:
Visit the Technical Inputs Manual: Double Divergence Pro for full parameter tuning.
Read the master guide on the Double Divergence Indicator Series.