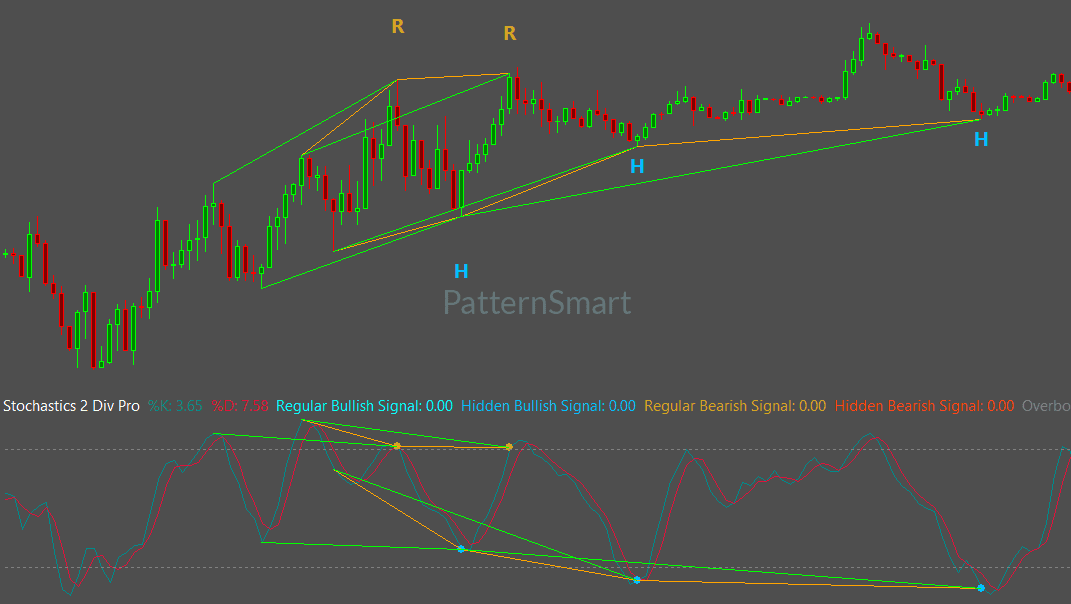
Stochastics Double Divergence for Sierra Chart is designed to help answer that question by combining Stochastics with the PatternSmart Double Divergence methodology.
Markets often move in waves. Price can rise strongly, slow down, pull back, and then attempt another move higher. The same process can happen during a decline. For traders learning technical analysis, one of the most useful questions is not simply “Is price going up or down?”, but also “Is momentum supporting the current price movement?”
Stochastics focuses on short-term momentum and the position of price within its recent trading range. This makes it particularly useful for studying market extremes, reversal timing, and changes in short-term momentum.
The Double Divergence methodology then provides a structured framework for comparing price behavior with Stochastics behavior and evaluating the resulting evidence.
The goal is not to predict the future. It is to help traders organize technical information and evaluate market conditions more systematically.
What Is Stochastics?
Stochastics is an oscillator that evaluates where the current price is positioned relative to its recent trading range.
In simple terms, it helps answer:
Is price currently closer to the upper or lower part of its recent range?
When price consistently moves toward the upper portion of its recent range, Stochastics can reflect stronger upward momentum. When price moves toward the lower portion, Stochastics can reflect stronger downward momentum.
This makes Stochastics especially useful for observing short-term momentum and market extremes.
It is important, however, not to interpret a high Stochastics reading as an automatic sell signal or a low reading as an automatic buy signal. A market can remain near an extreme while a strong trend continues.
Within Double Divergence analysis, the more important question is whether Stochastics continues to support what price is doing.
Understanding %K and %D
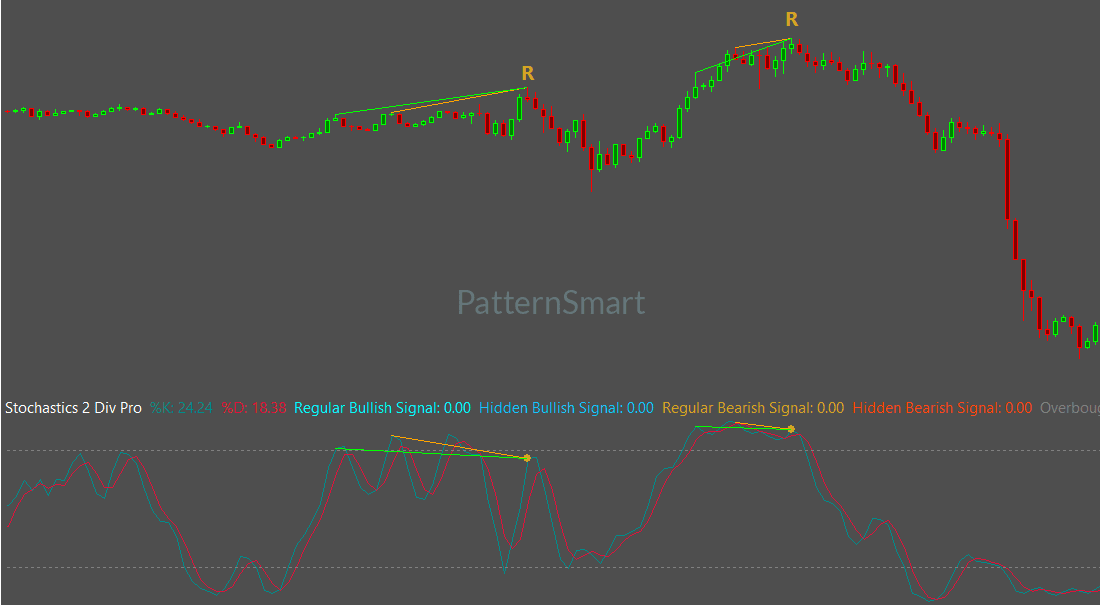
Stochastics commonly contains two lines:
- %K — the primary Stochastics line.
- %D — a smoothed line derived from %K.
Stochastics Double Divergence for Sierra Chart provides the ability to use the Stochastics calculation as part of the divergence analysis and includes a Divergence Value Mode that allows the analytical value to be based on K or D.
This gives traders flexibility when studying short-term momentum from slightly different perspectives.
The indicator also provides configurable K Period, K Slowing, and D Period inputs for the Stochastics calculation.
For beginners, the important idea is simple: Stochastics provides a momentum perspective, while Double Divergence compares that perspective with price behavior.
What Is Divergence?
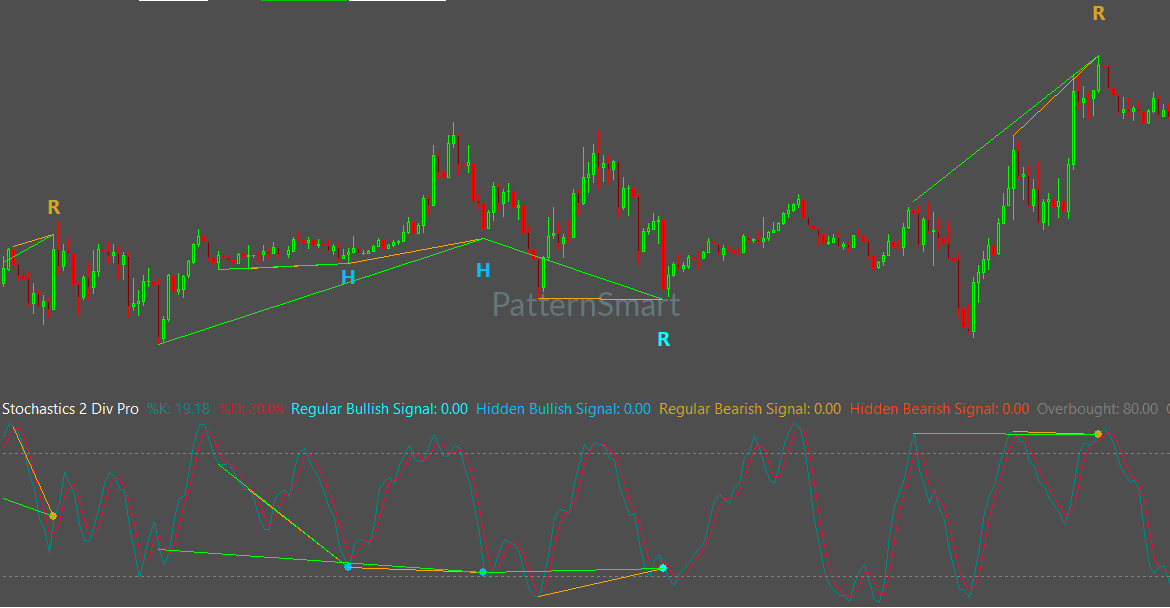
Divergence occurs when price and an indicator behave differently.
For example, suppose price makes a new high. If Stochastics makes a lower high instead, price and momentum are no longer moving together in the same way.
That difference is called divergence.
Divergence does not mean that price must reverse. Instead, it identifies a condition that deserves further evaluation.
The PatternSmart methodology treats divergence as information rather than prediction. Price remains the primary source of information, while the indicator provides additional technical evidence.
The Four Types of Stochastics Divergence
Stochastics Double Divergence identifies four official divergence categories.
Bullish Regular Divergence
Bullish Regular Divergence occurs when:
- Price forms a lower low
- Stochastics forms a higher low
Price has moved lower, but Stochastics has not made a corresponding lower low.
This may indicate that downward momentum is weakening. The condition can therefore be useful when evaluating possible reversal conditions, especially when supported by price structure or other technical evidence.
Bearish Regular Divergence
Bearish Regular Divergence occurs when:
- Price forms a higher high
- Stochastics forms a lower high
Price has reached a new high, but Stochastics has failed to match the previous momentum level.
This may suggest that upward momentum is weakening and that the current price movement deserves closer examination.
Bullish Hidden Divergence
Bullish Hidden Divergence occurs when:
- Price forms a higher low
- Stochastics forms a lower low
This type of divergence can be associated with a bullish continuation environment.
Instead of focusing primarily on a possible major reversal, traders can evaluate whether the temporary price pullback is consistent with the broader upward structure.
Bearish Hidden Divergence
Bearish Hidden Divergence occurs when:
- Price forms a lower high
- Stochastics forms a higher high
This can occur when price temporarily rallies during a broader bearish structure.
The divergence may provide additional evidence that the larger bearish condition remains relevant.
These four categories allow traders to distinguish between potential reversal conditions and potential continuation conditions rather than treating every divergence identically.
Why Double Divergence Matters
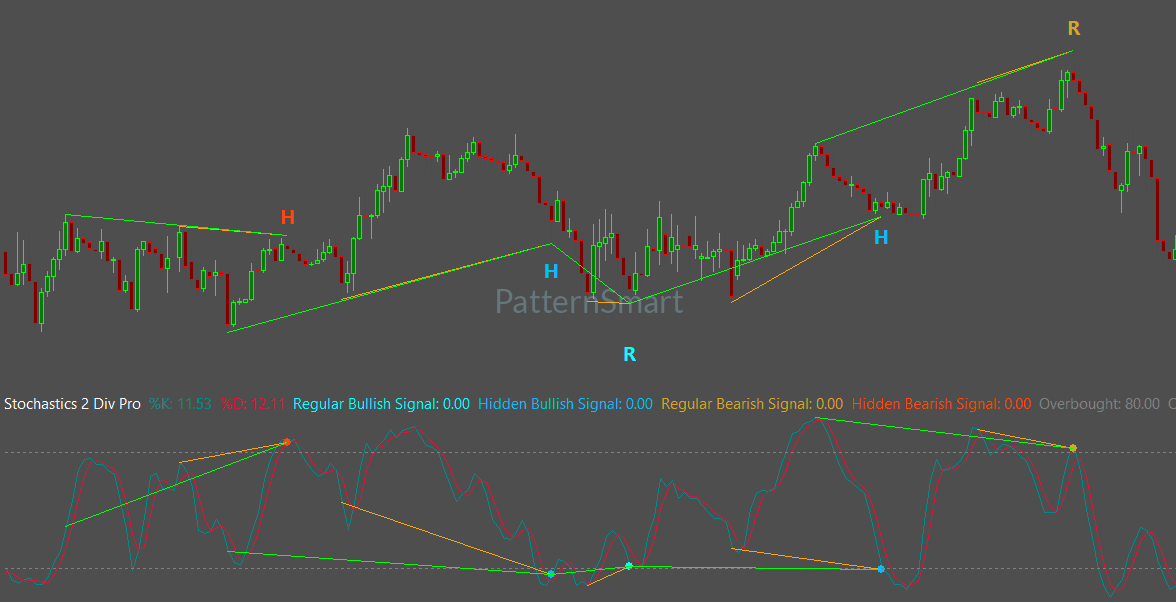
A single divergence observation can be useful, but the PatternSmart methodology places particular importance on confirmation.
The analytical process can be thought of as:
Price → Stochastics → Divergence → Market Context → Confirmation
First, examine price.
Next, examine Stochastics.
Then determine whether a recognized divergence relationship exists.
After that, consider the surrounding market structure. Finally, look for additional confirmation before making an independent trading decision.
Confirmation can include price action, support and resistance, trend structure, volatility, or higher-timeframe information.
Confirmation should increase analytical confidence, not create certainty.
Stochastics and Market Extremes
One reason Stochastics is particularly interesting for divergence analysis is its relationship with market extremes.
When price moves strongly toward the upper or lower portion of its recent range, Stochastics can help identify whether short-term momentum is also reaching an extreme.
This can be especially useful around turning points.
For example, a market may continue making higher highs while Stochastics produces progressively weaker highs. The price movement is still bullish, but the momentum perspective has changed.
That does not automatically mean the market will reverse. It means the relationship between price and momentum has become less consistent and may deserve additional attention.
This is why Stochastics Double Divergence is particularly relevant to reversal analysis, active swing trading, and short-term momentum evaluation.
Important Signal Controls
Stochastics Double Divergence for Sierra Chart provides separate controls for the four divergence categories:
- Show Regular Bullish
- Show Regular Bearish
- Show Hidden Bullish
- Show Hidden Bearish
Each setting independently controls whether its corresponding divergence type is calculated and displayed. This allows traders to study particular types of divergence without changing the underlying methodology.
Wait 1 Bar
Wait 1 Bar provides an additional confirmation stage.
When enabled, the indicator waits until the next bar has completely closed before finalizing a detected signal. This can provide additional confirmation and may reduce premature signal confirmation, although the signal can appear slightly later.
It changes when the signal becomes visible, not the underlying definition of divergence.
Enhanced Mode
Enhanced Mode provides additional structural validation for an eligible divergence signal.
It works as a filtering stage rather than searching for completely new divergence signals. This distinction is important: signal generation identifies potential divergence, while filtering applies additional evaluation before confirmation.
Understanding the Structural Settings
Three advanced parameters help control how divergence structures are evaluated.
Divergence Bar Range
Divergence Bar Range defines the structural search boundaries.
The available choices are:
- ShortRange
- MidRange
- LongRange
These options allow the indicator to examine relatively compact, intermediate, or broader historical relationships.
Divergence Lookback
Divergence Lookback controls the historical bars evaluated when identifying local swing highs and lows.
The default value is 5.
A larger lookback generally requires larger price structures before a swing point is recognized, while a smaller lookback can allow smaller movements to qualify.
Filter Length
Filter Length controls internal smoothing during structural evaluation.
Increasing the value produces smoother structural evaluation, while reducing it produces more responsive evaluation.
These settings should be understood as calculation parameters, not as independently defined trading strategies.
Keep the Chart Easy to Read
Technical analysis is easier when important information can be identified quickly.
The indicator includes Show Char and Show Line controls. These allow users to display signal labels and divergence lines according to their preferred chart presentation.
Only Show Last Signal Within Bars can help reduce nearby historical signals and improve visual clarity.
The Price Line Brush, Price Line Dash Style, and Price Line Width settings control the appearance of divergence lines. These are visualization settings and do not change divergence detection or confirmation.
Alerts for Confirmed Signals
For traders monitoring multiple charts, Enable Alert and Alert Sound provide notification options after qualifying signals have been confirmed.
Alerts are separate from signal generation and filtering. They communicate confirmed events but do not create or modify the underlying signals.
Stochastics Double Divergence on Sierra Chart
Sierra Chart is a high-performance professional charting platform recognized for performance, efficiency, precision, and analytical flexibility. Its environment is particularly suitable for traders who value detailed technical analysis and control over their charting workflow.
Stochastics Double Divergence fits naturally into this environment by adding structured divergence analysis to a professional charting workflow.
The platform provides the working environment; the Double Divergence methodology remains consistent across PatternSmart’s supported platforms.
A Simple Way to Start
Beginners do not need to change every setting immediately.
A practical learning process is:
1. Start with price.
Identify recent highs, lows, trends, and important market areas.
2. Observe Stochastics.
Watch how the oscillator behaves as price approaches important highs or lows.
3. Identify the divergence type.
Determine whether the relationship is Bullish Regular, Bearish Regular, Bullish Hidden, or Bearish Hidden Divergence.
4. Study the market context.
Ask whether the market is trending, pulling back, consolidating, or approaching an important price area.
5. Look for confirmation.
Use price action, market structure, support and resistance, or other technical evidence.
6. Make an independent decision.
Treat the indicator as analytical support rather than as an automatic trading system.
This approach encourages traders to learn what the indicator is communicating instead of simply reacting whenever a signal appears.
PatternSmart — Professional Technical Analysis Software
Explore Stochastics Double Divergence Pro for Sierra Chart
Looking for the complete mathematical breakdown, step-by-step optimization guides, and advanced trading strategies? Explore our comprehensive documentation:
Visit the Technical Inputs Manual: Double Divergence Pro for full parameter tuning.
Read the master guide on the Double Divergence Indicator Series.
Frequently Asked Questions
Is Stochastics Double Divergence only for reversal trading?
No. Regular Divergence is commonly useful for evaluating potential reversal conditions, while Hidden Divergence can provide information about continuation during pullbacks.
Does an overbought Stochastics reading mean price must fall?
No. An overbought or oversold condition alone does not guarantee a reversal. Strong trends can remain at extreme levels for extended periods.
What makes Stochastics different from RSI?
Both are useful momentum oscillators, but Stochastics focuses particularly on the relative position of price within its recent range. PatternSmart identifies Stochastics as especially relevant to short-term momentum, market extremes, and reversal timing.
Should beginners change all the settings?
Not necessarily. The most useful starting point is understanding how the default configuration behaves before experimenting with individual parameters. Changes to Divergence Bar Range, Divergence Lookback, and Filter Length can influence structural evaluation and signal frequency.
Does changing chart appearance change the signals?
No. Display settings such as Show Char, Show Line, line style, and line width affect presentation rather than the underlying analytical process.
Conclusion
Stochastics Double Divergence provides a structured way to study short-term momentum, market extremes, and potential reversal or continuation conditions.
The central concept is straightforward: price tells you what the market is doing, while Stochastics provides another perspective on short-term momentum. When those two perspectives begin to disagree, divergence identifies a relationship worth examining.
The most effective use of the indicator is therefore not to treat every signal as an immediate trading instruction. Instead, use divergence as one piece of technical evidence and evaluate it within the broader context of price structure and market behavior.
For Sierra Chart users, Stochastics Double Divergence brings this methodology into a high-performance and precision-oriented charting environment, supporting a more organized approach to studying momentum and market extremes.
Explore Stochastics Double Divergence on your own Sierra Chart charts and use the methodology as a framework for learning, evaluating, and interpreting market behavior.