Identify Trend Exhaustion Through Double Divergence Confirmation
ADX Double Divergence Pro for MultiCharts is a technical analysis indicator designed to help traders identify potential changes in trend strength through a structured Double Divergence framework.
Instead of treating divergence as a standalone reversal signal, the indicator focuses on the relationship between price behavior and ADX trend-strength information. It can highlight regular bullish, hidden bullish, regular bearish, and hidden bearish divergence, giving traders a broader framework for evaluating whether an established trend may be losing directional strength.
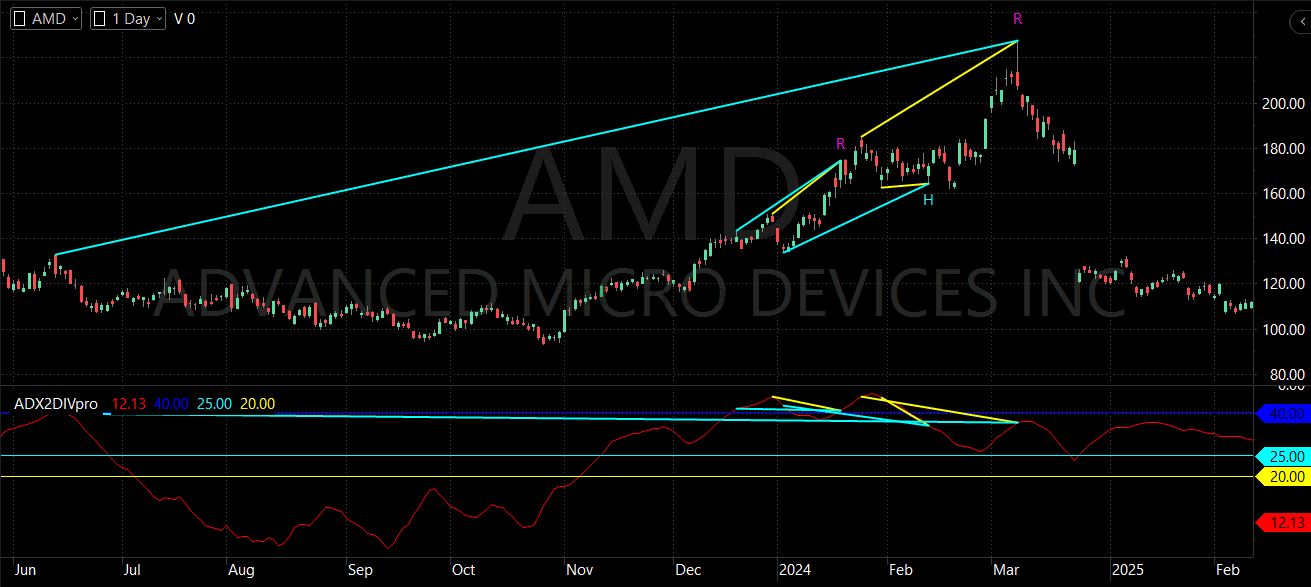
[Get ADX Double Divergence Pro]
When a Strong Trend Starts Losing Strength
One of the challenges in reversal analysis is that a trend can continue long after the first signs of weakening appear.
A price move may keep making new highs or lows even as the underlying trend becomes less sustainable. Looking at price alone can therefore make it difficult to distinguish a temporary slowdown from more meaningful trend exhaustion.
ADX Double Divergence Pro approaches this problem by combining price structure with ADX-based trend-strength analysis.
| Common Trading Challenge | How ADX Double Divergence Pro Helps |
|---|---|
| A mature trend continues despite early warning signs | Highlights divergence between price behavior and trend strength |
| Traditional divergence may appear too early | Uses a Double Divergence framework for additional confirmation |
| Bullish and bearish divergence can be difficult to compare consistently | Separates regular and hidden bullish/bearish signals |
| Important divergence relationships are easy to miss visually | Draws signal markers and connecting divergence lines |
| Too many nearby historical signals can clutter a chart | Provides an option to limit recently displayed signals |
The objective is not to predict every market turning point. It is to give traders a structured way to examine trend weakening and potential exhaustion.
Key Features
1. Four Types of Double Divergence
ADX Double Divergence Pro can identify four distinct signal categories:
- Regular Bullish Divergence
- Hidden Bullish Divergence
- Regular Bearish Divergence
- Hidden Bearish Divergence
This allows traders to distinguish between different price/trend-strength relationships instead of treating every divergence as the same event.
A bullish signal can provide evidence that a declining market may be losing strength, while a bearish signal can highlight weakening strength within an advancing market. These signals are analytical observations—not guarantees of an immediate reversal.
2. ADX-Based Trend Strength Analysis
The indicator uses ADX as its underlying analytical perspective.
Unlike indicators primarily designed around overbought and oversold conditions, ADX focuses on trend strength rather than simply whether price is high or low.
This makes the indicator particularly relevant when analyzing:
- Established trends
- Mature directional moves
- Potential trend exhaustion
- Transition from trend to consolidation
- Progressive weakening of directional commitment
The result is a divergence tool designed specifically around the question:
Is the existing trend still demonstrating the strength needed to continue?
3. Short, Medium, and Long Divergence Ranges
The indicator provides three selectable divergence-range modes:
- Short Range
- Mid Range
- Long Range
These modes allow traders to adjust the structural scale used for divergence analysis.
A shorter range can be useful when examining relatively closer price structures, while broader ranges can be used when the objective is to evaluate more extended market swings.
The appropriate choice can depend on the instrument, timeframe, volatility, and trading style.
4. Clear Chart-Based Visualization
When enabled, divergence signals are displayed directly through chart annotations.
The indicator can display:
- Bullish and bearish signal markers
- Price divergence lines
- Corresponding ADX-panel divergence lines
- Configurable line colors
- Adjustable line width
- Adjustable line style
This creates a visual connection between what price is doing and what ADX is showing, making the divergence relationship easier to inspect.
5. Configurable Alerts and Signal Display
ADX Double Divergence Pro includes an alert option for the four supported divergence signal types.
Traders can also control whether regular or hidden bullish/bearish signals are displayed.
An additional display-control feature can limit how long a previous signal remains visible when another signal of the same category appears within the configured interval. This can help reduce unnecessary chart clutter.
See the Divergence Relationship, Not Just the Signal
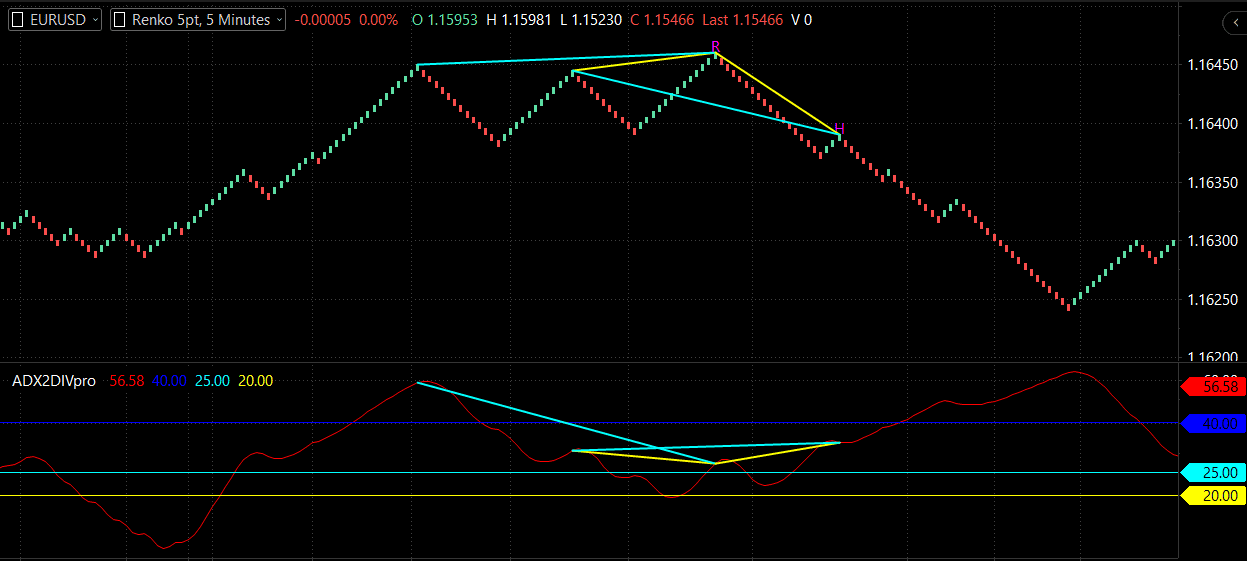
A major advantage of a visual divergence indicator is that the trader can inspect the underlying relationship instead of relying exclusively on a label.
For example, when a bullish divergence is identified, the chart can show the relationship between relevant price lows while the indicator panel simultaneously illustrates the corresponding ADX relationship.
The same visual approach applies to bearish divergence using price highs.
This makes the chart useful for analysis and education, not merely signal collection.
Signal Behavior and Confirmation
ADX Double Divergence Pro uses swing-based price structures and ADX observations to identify its divergence conditions.
The indicator also includes an optional Wait setting. When enabled, the signal evaluation incorporates an additional confirmation step and requires the signal bar’s direction to agree with the corresponding bullish or bearish condition.
Timeframes & Markets
ADX Double Divergence Pro is a MultiCharts indicator that can be applied to charts using different instruments and intervals.
The ADX Double Divergence framework is particularly relevant to markets characterized by established directional movement, including:
- Futures
- Forex
- Stock indices
- Individual equities
- Commodities
- Cryptocurrency markets
The framework is especially suited to analyzing established trends and mature directional moves. It may be less informative during prolonged sideways or highly irregular conditions.
Typical analytical applications include:
- Intraday trend analysis
- Medium-term trend analysis
- Swing trading
- Trend-reversal analysis
- Position-oriented analysis
The most appropriate settings should be selected according to the instrument, timeframe, volatility, and trading approach.
What You Actually See on the Chart
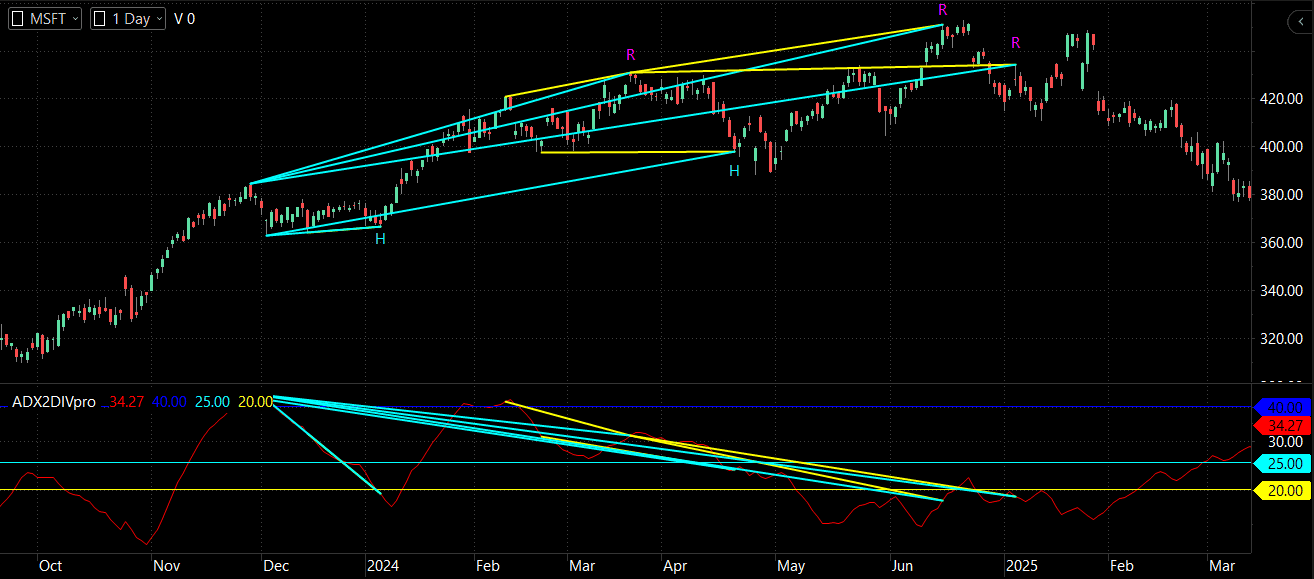
When ADX Double Divergence Pro is applied to a MultiCharts chart, the indicator provides a dedicated ADX analysis panel together with optional chart annotations.
ADX Panel
The indicator plots:
- The ADX line
- An upper reference line
- A middle reference line
- A lower reference line
The default reference levels are configurable, allowing traders to adapt the visual framework to their analytical preferences.
Price Chart
When enabled, divergence markers appear around the relevant price structure.
The indicator can also draw two connecting lines between the price structures involved in the divergence.
ADX Divergence Visualization
Corresponding lines can be drawn in the ADX panel, allowing traders to compare the price-side divergence with the ADX-side relationship.
Together, these elements create a visual workflow:
Price Structure → ADX Behavior → Double Divergence → Market Context
How ADX Double Divergence Works
At a conceptual level, the methodology can be understood in several stages.
1. Establish the Market Context
First identify whether the market is trending, consolidating, or transitioning between conditions.
2. Observe Trend Strength
ADX provides information about the strength of the prevailing trend. A weakening trend does not automatically mean a reversal, but it can indicate reduced directional commitment.
3. Examine Price and ADX Relationships
The indicator looks for specific relationships between price structures and ADX behavior that satisfy its Double Divergence framework.
4. Classify the Divergence
The resulting condition can be classified as regular bullish, hidden bullish, regular bearish, or hidden bearish.
5. Confirm With Market Structure
The divergence should then be evaluated against price action, support/resistance, and the broader trend.
The purpose is to help traders identify progressive trend weakening, rather than attempting to forecast every short-term price fluctuation.
Practical Trading Application
ADX Double Divergence Pro is best viewed as a decision-support tool, not an automatic trading system.
Potential Bullish Workflow
A trader might consider:
- An established bearish trend is visible.
- Price continues to press toward lower levels.
- ADX-related trend-strength behavior begins to show deterioration.
- A bullish Double Divergence signal develops.
- Price structure provides additional confirmation.
- The trader defines entry, stop-loss, and target according to an independent risk-management plan.
The divergence does not mean that price must immediately reverse. A market can continue declining after a bullish divergence appears.
Potential Bearish Workflow
A similar process can be applied to an established bullish trend:
- Price continues advancing.
- The trend becomes mature.
- ADX behavior suggests weakening trend strength.
- A bearish Double Divergence signal develops.
- Price action or resistance provides additional confirmation.
- The trader structures the trade according to their own risk-management rules.
This approach keeps the signal in its proper context:
Signal → Context → Confirmation → Execution → Risk Management
Confirmation & Market Context
ADX divergence should not be interpreted in isolation.
A declining ADX does not automatically mean that a reversal is about to occur. It indicates that the existing trend may be losing strength.
Useful confirmation can include:
- Price structure
- Support and resistance
- Candlestick behavior
- Broader trend direction
- Higher-timeframe context
- Other technical-analysis tools
For example, a bearish divergence occurring directly beneath significant resistance may deserve a different interpretation from the same divergence appearing in the middle of an otherwise strong bullish trend.
The goal is to combine the indicator’s information with the market environment rather than automatically converting every signal into a trade.
Parameter Flexibility
ADX Double Divergence Pro exposes several user-configurable controls so traders can adapt the visual and analytical framework.
Important categories include:
ADX Settings
The ADX calculation period and smoothing-related setting can be adjusted.
Divergence Settings
Traders can adjust the divergence lookback and choose between short-, medium-, and long-range divergence analysis.
Swing Search
The indicator provides a configurable search range for identifying relevant price structures.
Signal Display
Users can independently control:
- Regular bullish signals
- Hidden bullish signals
- Regular bearish signals
- Hidden bearish signals
- Signal characters
- Divergence lines
- Alerts
Visual Settings
Line color, width, and style can also be customized.
These controls allow the indicator to be adapted to different charting preferences without changing its core purpose.
Practical Benefits
ADX Double Divergence Pro is designed to help traders:
- Recognize weakening trend strength more systematically
- Examine potential trend exhaustion
- Distinguish between regular and hidden divergence
- Visualize price/ADX divergence relationships
- Reduce dependence on manually drawing divergence relationships
- Maintain a more structured reversal-analysis workflow
- Adapt divergence analysis to different structural ranges
Its primary value is clarity of analysis, not a promise of prediction or profitability.
Who Is ADX Double Divergence Pro For?
This indicator is particularly relevant for traders who already understand basic technical analysis and want a more structured approach to divergence analysis.
It may be suitable for:
- Intermediate traders studying divergence
- Advanced traders analyzing trend exhaustion
- Swing traders evaluating mature directional moves
- Trend-reversal traders looking for weakening trends
- Technical analysts who want ADX-based confirmation
It can be less suitable for traders looking primarily for very frequent short-term signals, since the ADX approach is intentionally more focused on established trends and trend exhaustion.
Built for MultiCharts
ADX Double Divergence Pro is specifically designed for MultiCharts, bringing the PatternSmart Double Divergence methodology into a MultiCharts charting workflow.
The indicator’s visual output is designed to keep the important information close to the chart:
Price Structure + ADX + Divergence Visualization + Alerts
This makes it possible to study potential trend exhaustion without relying exclusively on manually comparing separate charts or indicators.
[Get ADX Double Divergence Pro for MultiCharts]
Frequently Asked Questions
Is ADX Double Divergence Pro suitable for beginners?
It can be used by developing traders, but a basic understanding of ADX, divergence, price structure, and technical analysis is recommended. The indicator is particularly valuable for traders who want to develop a more structured understanding of trend exhaustion.
Does it identify bullish and bearish divergence?
Yes. It supports regular bullish, hidden bullish, regular bearish, and hidden bearish divergence conditions.
Does the indicator repaint?
No.
Can I adjust the divergence range?
Yes. The indicator provides Short Range, Mid Range, and Long Range modes for divergence analysis.
Can I customize the signals?
Yes. Regular and hidden bullish/bearish signals can be independently enabled or disabled. Signal characters, divergence lines, line appearance, and alerts can also be controlled.
Does it provide alerts?
Yes. Alert functionality is included for the supported divergence signal categories.
Can ADX divergence be used as an automatic entry signal?
It should not be treated as an automatic trading system. A divergence signal represents a change or potential weakening in market conditions. Price structure, confirmation, execution rules, and risk management remain important.
Which markets can I analyze?
The ADX Double Divergence framework can be applied to markets such as futures, Forex, stock indices, equities, commodities, and cryptocurrencies. Different instruments and market conditions may require different settings and confirmation approaches.
Turn Trend Weakening Into a Structured Analysis
Strong trends do not always reverse when the first warning appears. The more important question is whether the evidence of weakening continues to develop.
ADX Double Divergence Pro for MultiCharts gives traders a structured visual framework for examining that process through ADX-based trend-strength analysis and Double Divergence confirmation.
Use it to study the relationship between price structure, trend strength, divergence, and market context—and make those observations part of a broader trading plan.
[Get Started With ADX Double Divergence Pro for MultiCharts]
Educational use only. Trading involves substantial risk, and past market behavior does not guarantee future results. Indicator signals are analytical tools and should not be considered financial advice or guarantees of trading performance.
Looking for the complete mathematical breakdown, step-by-step optimization guides, and advanced trading strategies? Explore our comprehensive documentation:
Visit the Technical Inputs Manual: Double Divergence Pro for full parameter tuning.
Read the master guide on the Double Divergence Indicator Series.