A Clearer Way to Study Trend Transitions and Changing Momentum
MACD Double Divergence Pro for Sierra Chart combines the widely used Moving Average Convergence Divergence (MACD) indicator with the PatternSmart Double Divergence methodology.
For beginners, one of the most important lessons in technical analysis is that a market can continue moving in the same direction even when the strength behind that movement is beginning to change.
Price may continue making higher highs while momentum gradually weakens. Likewise, price may continue making lower lows while downward momentum begins to lose strength.
MACD can help traders observe these changes in momentum and trend development. Double Divergence adds a confirmation-based framework that helps traders evaluate whether momentum deterioration is developing consistently rather than reacting to a single divergence observation.
The result is a technical-analysis tool designed to help traders study trend transitions, momentum confirmation, trend development, and medium-term market structure.
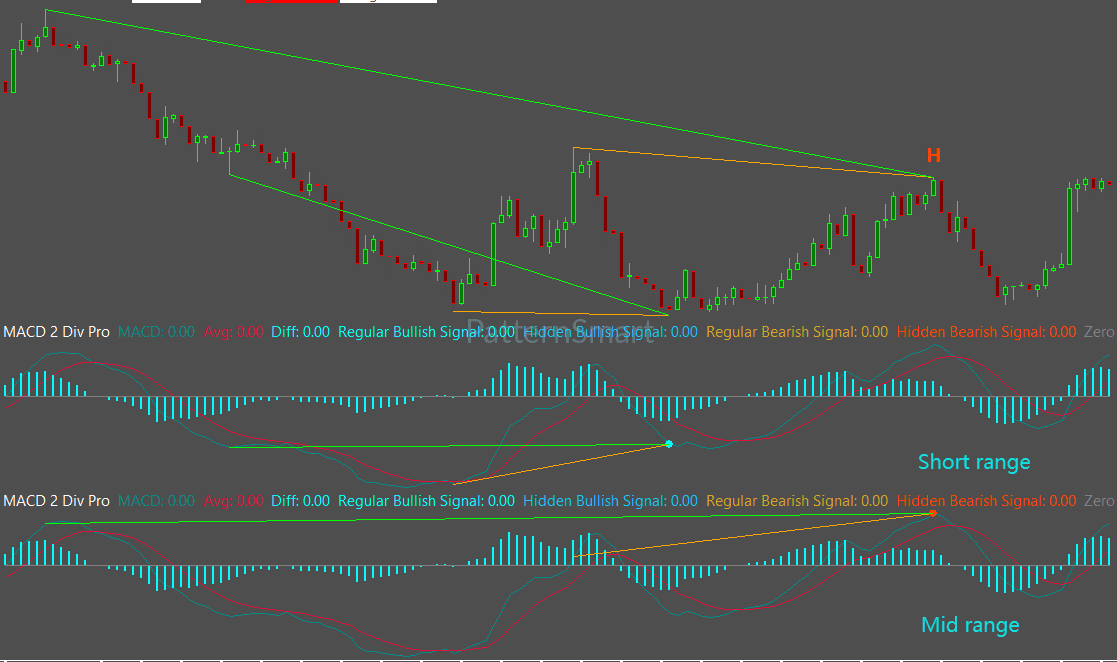
What Is MACD?
MACD stands for Moving Average Convergence Divergence.
It is a trend-following momentum indicator that evaluates the relationship between moving averages.
The basic idea is relatively simple.
A shorter-term moving average responds more quickly to recent price movement, while a longer-term moving average responds more slowly. MACD uses the relationship between these moving averages to help show how momentum and trend development are changing.
MACD commonly includes three components:
- MACD Line
- Signal Line
- Histogram
Together, these components provide different ways to observe changes in momentum, including momentum acceleration and deceleration.
For beginners, it is useful to think of MACD as a way of asking:
Is the current trend continuing to develop with the same momentum, or is that momentum beginning to change?
This makes MACD different from indicators that primarily focus on overbought or oversold conditions.
MACD is particularly useful for understanding how momentum develops during a trend.
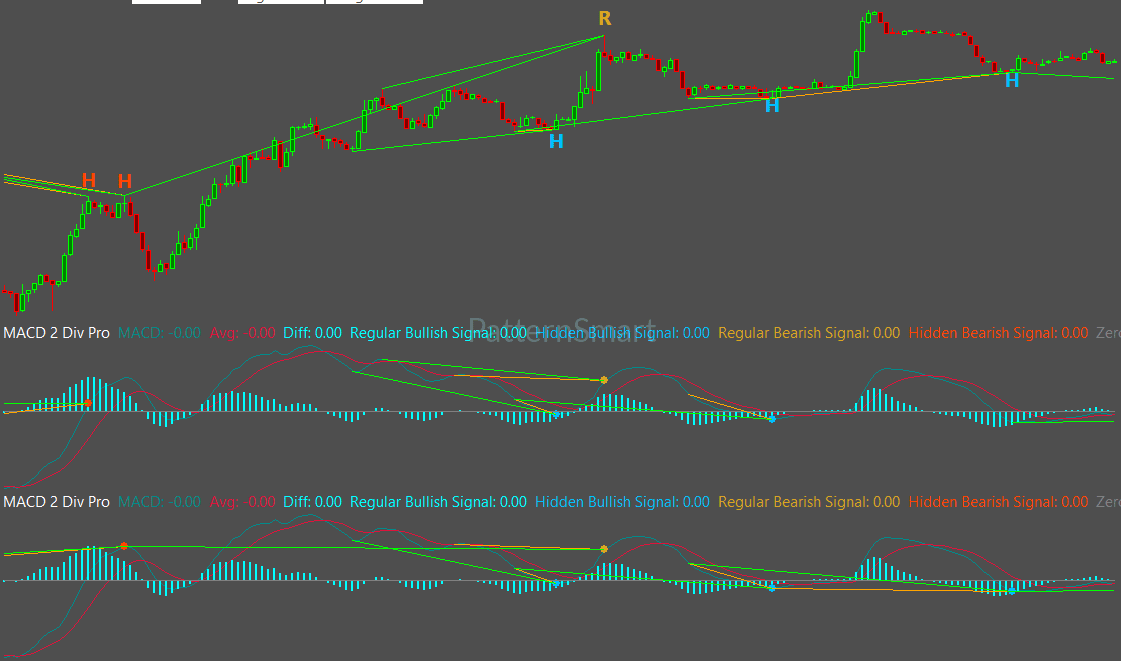
What Does MACD Measure?
MACD provides information about several related aspects of market behavior:
- Trend momentum
- Momentum acceleration
- Momentum deceleration
- Trend continuation
- Trend transition
- Directional conviction
Suppose a market has been rising steadily.
Price is still making higher highs, but MACD begins showing progressively weaker momentum. The market has not necessarily reversed, but the relationship between price and momentum has changed.
That change deserves attention.
Similarly, during a declining market, price may continue making lower lows while MACD shows that downward momentum is becoming less pronounced.
These situations can become particularly interesting when studying mature trends and potential transitions.

What Is Divergence?
Divergence occurs when price and an indicator do not move together in the expected way.
Consider a simple example.
Price makes a new high.
However, MACD does not make a corresponding new high.
Price is still rising, but MACD is providing less confirmation of that upward movement.
This is called Bearish Regular Divergence.
The opposite situation can occur when price makes a new low while MACD forms a higher low. This is Bullish Regular Divergence.
Divergence does not mean that a reversal must occur.
Instead, it provides additional information that the relationship between price and momentum has changed.
That distinction is important for beginners.
A divergence signal is an analytical observation, not a guaranteed prediction.
What Is Double Divergence?
Traditional divergence can sometimes appear before the existing trend has actually changed.
For example, a strong upward trend may produce a bearish divergence while the market continues higher for some time.
This is one reason why simply reacting to the first divergence observation can be problematic.
The PatternSmart Double Divergence methodology emphasizes confirmation.
Rather than focusing only on an isolated divergence, the methodology evaluates whether momentum deterioration develops through additional stages of confirmation.
The objective is to distinguish temporary momentum slowing from more meaningful changes in trend behavior.
In practical terms, the methodology encourages traders to move through a process of:
Observation → Evaluation → Confirmation → Interpretation
Confirmation increases analytical confidence, but it does not create certainty.
Understanding the Four Divergence Types
MACD Double Divergence uses four official divergence classifications.
Bullish Regular Divergence
Bullish Regular Divergence generally has this structure:
Price: Lower Low
MACD: Higher Low
Price continues moving downward, but MACD shows less downward momentum.
This may indicate that bearish momentum is weakening and that changing market conditions deserve closer examination.
It does not automatically mean that price will reverse upward.
Bearish Regular Divergence
Bearish Regular Divergence generally has this structure:
Price: Higher High
MACD: Lower High
Price continues advancing, while MACD shows weaker momentum.
This may provide evidence that bullish momentum is losing strength.
The broader market structure and additional confirmation remain important.
Bullish Hidden Divergence
Bullish Hidden Divergence generally has this structure:
Price: Higher Low
MACD: Lower Low
This type of divergence can be relevant when an established bullish trend experiences a temporary correction.
Rather than primarily questioning the existence of the trend, Hidden Divergence can provide information relevant to potential trend continuation.
Bearish Hidden Divergence
Bearish Hidden Divergence generally has this structure:
Price: Lower High
MACD: Higher High
This can occur during an established bearish trend when price experiences a temporary upward correction.
The observation may provide information about whether the broader bearish structure remains intact.
As with every divergence classification, context and confirmation remain essential.
Why Confirmation Matters
A common beginner mistake is to treat every divergence as an immediate reversal signal.
Double Divergence takes a different approach.
Imagine that price has been rising for several weeks. MACD begins showing weaker momentum, creating an initial divergence.
That observation is useful, but it does not tell the entire story.
The market could:
- Continue trending higher.
- Move sideways temporarily.
- Begin a deeper correction.
- Eventually transition into a bearish trend.
This is why confirmation matters.
Double Divergence is designed to provide additional analytical evidence as the relationship between price and MACD develops.
Traders can then consider that evidence together with:
- Price action
- Market structure
- Support and resistance
- Trend direction
- Broader market conditions
The methodology is therefore intended to improve interpretation, rather than promise a particular market outcome.
MACD and Trend Transitions
Trend transition is one of the most important applications of MACD Double Divergence.
A trend does not necessarily change direction in one sudden event.
It may develop through several stages:
Strong trend → Slowing momentum → Momentum deterioration → Transition → New directional development
MACD can help traders observe these stages because it focuses on how momentum develops relative to price.
This makes it particularly useful when analyzing:
- Developing trends
- Mature trends
- Transition phases
- Medium-term market structure
- Momentum confirmation
For beginners, the key lesson is that price direction and momentum are related but not identical.
A market can still be moving higher while its upward momentum is weakening.
Likewise, a market can still be moving lower while its downward momentum is losing strength.
When Is MACD Double Divergence Most Useful?
The MACD knowledge base identifies several environments where this approach can be particularly useful:
- Trending markets
- Medium-term trends
- Developing trends
- Transition phases
MACD is especially suited to traders interested in:
- Trend following
- Swing trading
- Position trading
- Trend transition analysis
- Momentum confirmation
Because MACD tends to provide a smoother perspective than faster oscillators, it may be less responsive to very rapid market changes.
That is not necessarily a weakness. It simply means MACD provides a particular analytical perspective.
Understanding the characteristics of an indicator is more important than expecting every indicator to behave the same way.
MACD Double Divergence Pro for Sierra Chart
Sierra Chart is a high-performance professional charting platform recognized for speed, efficiency, precision, and extensive analytical flexibility.
It is commonly associated with futures traders, professional technical analysts, order-flow traders, and other performance-oriented users.
For this type of environment, MACD Double Divergence can provide an additional layer of structured momentum analysis within an existing professional charting workflow.
The platform affects the user experience and workflow, but it does not change the Double Divergence methodology.
The same divergence classifications and confirmation philosophy remain consistent across PatternSmart-supported platforms.
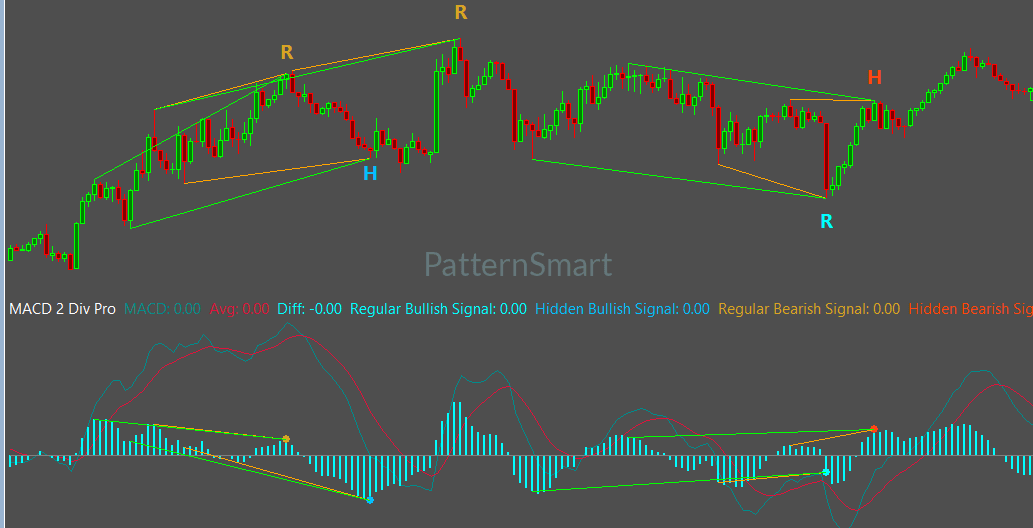
Configurable Double Divergence Analysis
The Pro version provides controls that allow traders to adjust how signals are generated, filtered, displayed, and communicated.
Signal Selection
The indicator provides controls for:
- Show Regular Bullish
- Show Regular Bearish
- Show Hidden Bullish
- Show Hidden Bearish
These options allow traders to choose which divergence categories they want displayed.
For example, a trader studying potential trend transitions may choose to concentrate on Regular Divergence, while another trader may also want Hidden Divergence for continuation analysis.
Wait 1 Bar
Wait 1 Bar adds one completed confirmation bar before a detected Double Divergence signal is finalized.
When enabled, the indicator waits for the next bar to close before confirming the signal.
This can provide additional confirmation and help reduce premature signal confirmation during rapidly changing conditions.
It changes when a signal becomes confirmed, not the underlying Double Divergence methodology.
Enhanced Mode
Enhanced Mode provides additional structural filtering for potential signals.
For beginners, the simplest way to understand it is as an additional filtering stage.
It helps refine the structural conditions used before a signal is confirmed.
Enhanced Mode does not create a different divergence methodology. It works within the existing Double Divergence framework.
Divergence Bar Range, Divergence Lookback, and Filter Length
The Pro indicator also includes advanced parameters for structural evaluation.
Divergence Bar Range controls the structural search boundaries.
Divergence Lookback controls swing-point detection.
Filter Length controls the internal smoothing used during structural evaluation.
These settings can influence structural sensitivity and signal behavior. They should be viewed as configuration tools rather than as different trading strategies.
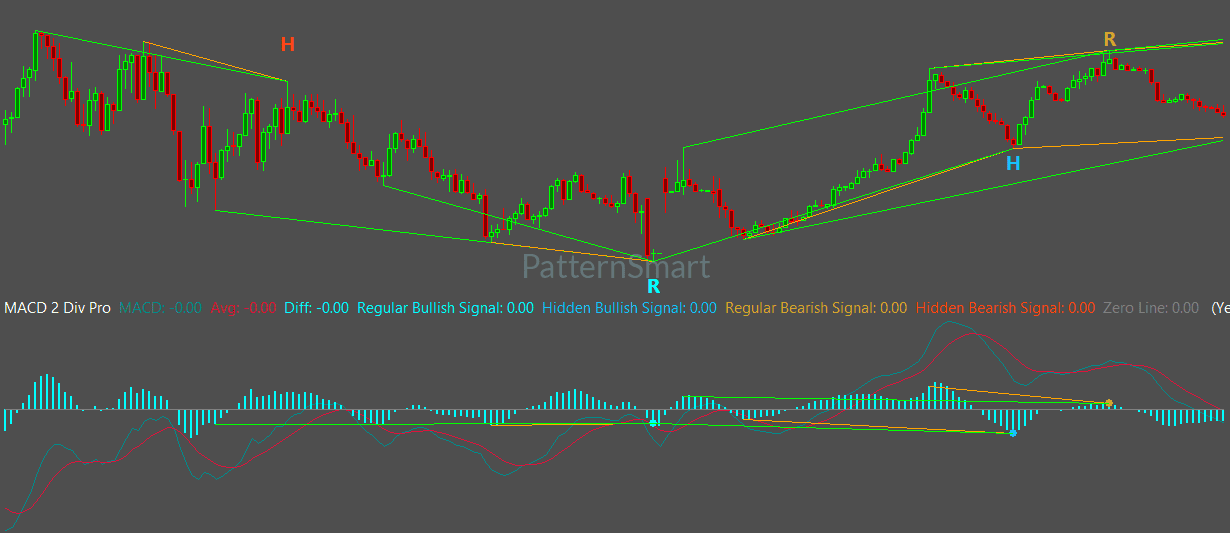
Clear Chart Visualization
The indicator includes display controls such as:
- Show Char
- Show Line
- Only Show Last Signal Within Bars
- Price Line Brush
- Price Line Dash Style
- Price Line Width
These controls allow traders to organize how divergence information appears on the chart.
For beginners, good chart organization is important because too much information can make technical analysis harder rather than easier.
The visualization settings therefore help users create a chart presentation that fits their analytical workflow.
Alerts
The Pro version also includes:
- Enable Alert
- Alert Sound
These features provide notification options for detected signals.
Alerts can help reduce the need to continuously watch every chart, while the trader remains responsible for evaluating the broader market context before making a decision.
A Simple Beginner Workflow
If you are new to MACD Double Divergence, start with the following process.
Step 1: Start With Price
First determine whether the market is generally rising, falling, consolidating, or transitioning.
Step 2: Observe MACD
Look at how MACD momentum is developing while price moves.
Step 3: Compare Price and MACD
Ask whether price is making a new high or low while MACD is failing to make a corresponding extreme.
Step 4: Identify the Divergence
Determine whether the observation is:
- Bullish Regular Divergence
- Bearish Regular Divergence
- Bullish Hidden Divergence
- Bearish Hidden Divergence
Step 5: Look for Confirmation
Examine market structure, price action, support, resistance, and the broader trend.
Step 6: Interpret the Complete Picture
Use the Double Divergence signal as one piece of technical evidence rather than treating it as an automatic trading instruction.
This approach encourages disciplined analysis and keeps the focus on understanding market behavior.
Explore MACD Double Divergence Pro for Sierra Chart
Looking for the complete mathematical breakdown, step-by-step optimization guides, and advanced trading strategies? Explore our comprehensive documentation:
Visit the Technical Inputs Manual: Double Divergence Pro for full parameter tuning.
Read the master guide on the Double Divergence Indicator Series.
Frequently Asked Questions
What is MACD Double Divergence?
MACD Double Divergence combines the Moving Average Convergence Divergence indicator with the PatternSmart Double Divergence confirmation methodology. It is designed to help analyze changing momentum, trend transitions, and developing market structure.
Is MACD Double Divergence a reversal indicator?
It can identify conditions associated with weakening momentum and potential trend transitions, but it does not guarantee a reversal. Additional confirmation remains important.
What does Bullish Regular Divergence mean?
It occurs when price makes a lower low while MACD makes a higher low. This may indicate that bearish momentum is weakening.
What does Bearish Regular Divergence mean?
It occurs when price makes a higher high while MACD makes a lower high. This may indicate that bullish momentum is weakening.
What is Hidden Divergence used for?
Hidden Divergence is commonly associated with continuation analysis following temporary price corrections within an existing trend.
Is MACD suitable for beginners?
Yes. MACD provides a useful framework for learning how momentum and trend development interact. Beginners should focus first on understanding the relationship between price and MACD rather than immediately changing advanced settings.
Does Double Divergence guarantee better signals?
No. Double Divergence is a confirmation-based analytical methodology. Confirmation can increase analytical confidence, but it cannot eliminate uncertainty from financial markets.
Conclusion
MACD provides a useful way to study trend momentum, momentum acceleration, momentum deceleration, trend development, and trend transitions.
The PatternSmart Double Divergence methodology adds a confirmation-focused approach that encourages traders to look beyond the first divergence observation and evaluate whether momentum deterioration develops consistently.
For Sierra Chart users, MACD Double Divergence Pro brings this analysis into a high-performance and precision-oriented charting environment.
The most important concept for beginners is simple:
Price tells you what the market is doing. MACD helps you examine how momentum is developing. Double Divergence helps you evaluate whether changes in that momentum deserve additional confirmation.
Used this way, MACD Double Divergence becomes an educational tool for organizing technical evidence and developing a more structured understanding of trend transitions—not a system for predicting the future with certainty.