Advanced Momentum Analysis for Early Market Transitions
Momentum Double Divergence Pro for SierraChart combines the classic Momentum indicator with the PatternSmart Double Divergence methodology to provide a structured framework for analyzing rate of price change, momentum acceleration, momentum deceleration, and early trend development.
For experienced traders, the value of Momentum is not simply whether price is rising or falling. The more important question can be how quickly price is changing and whether that rate of change is accelerating or decelerating.
A market may continue making higher highs while its rate of price change begins to deteriorate. Conversely, price can continue declining while downside acceleration begins to weaken. These changes may occur before a visible change in trend direction.
Momentum Double Divergence is designed to help identify and evaluate these developing changes while maintaining the PatternSmart emphasis on confirmation rather than prediction.
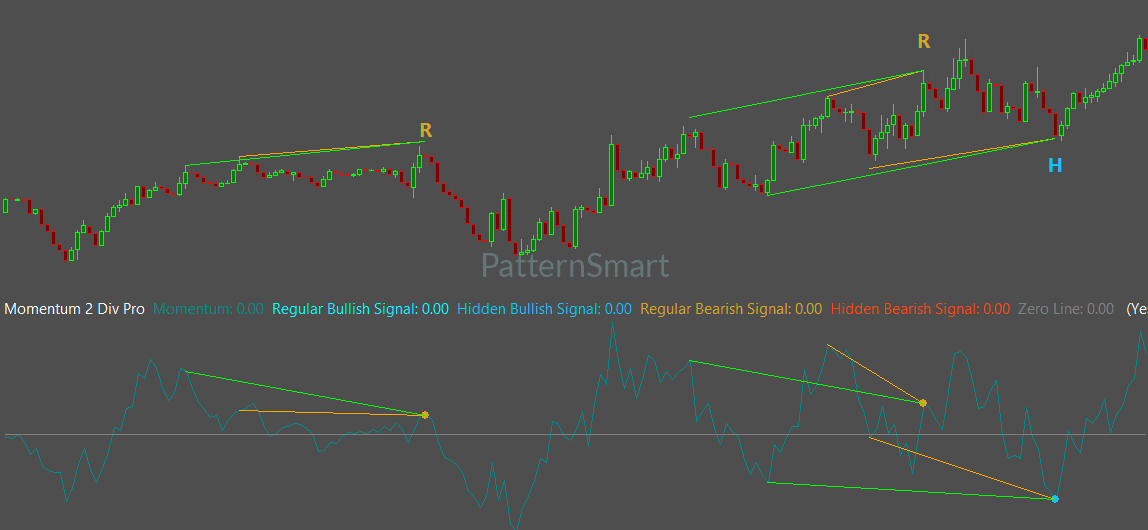
Momentum Measures Rate of Price Change
The Momentum indicator compares the current price with the price from a specified number of previous periods.
Its analytical focus is therefore different from indicators that use moving averages, statistical normalization, or volume.
Momentum directly reflects the rate at which price is changing.
When price accelerates in the prevailing direction, Momentum generally strengthens. When price begins moving less aggressively, Momentum can decline even though price itself continues in the same direction.
This distinction is important.
Price Direction vs. Price Acceleration
Consider an established bullish market.
Price continues making higher highs, so the trend remains upward. However, each successive advance is becoming smaller or less rapid.
The trend has not necessarily reversed.
What has changed is the rate of price change.
This creates an important analytical distinction between:
- Price direction
- Momentum acceleration
- Momentum deceleration
- Trend development
- Trend exhaustion
Momentum Double Divergence is specifically designed to examine this relationship.
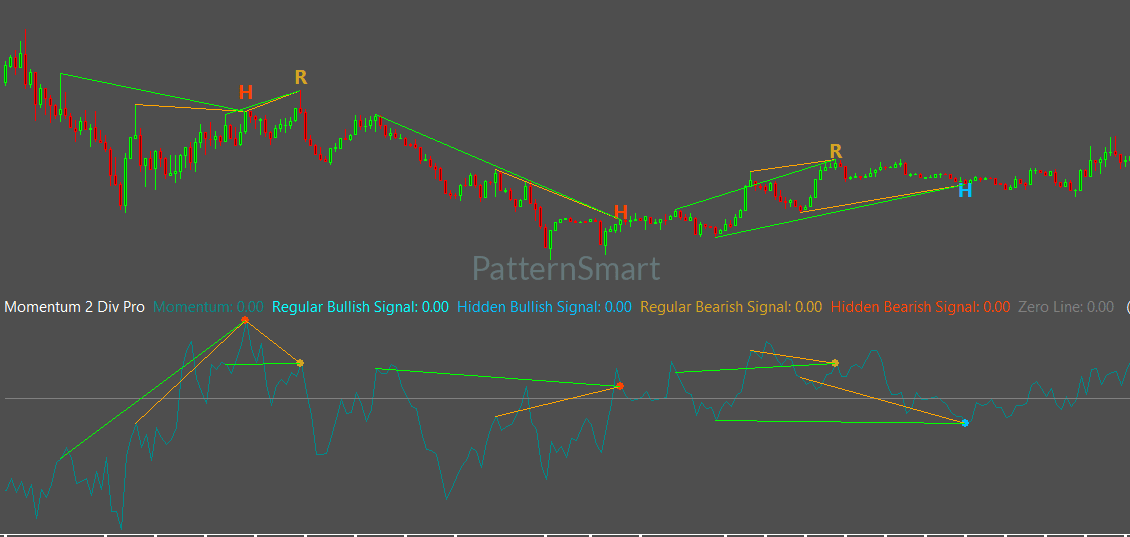
Why Momentum Is Valuable for Divergence Analysis
Traditional divergence analysis compares price with an indicator to identify situations where the two are no longer moving in complete agreement.
Momentum is particularly useful for this purpose because it reacts directly to changes in price acceleration.
A divergence can therefore develop while the market still appears to be trending normally on the price chart.
For example:
Price: Higher High
Momentum: Lower High
Price has advanced to a new high, but the rate of price change has not matched the previous advance.
This may indicate momentum deceleration and deserves further evaluation.
The same principle applies in declining markets.
Price: Lower Low
Momentum: Higher Low
Price has continued downward, but downside acceleration has weakened.
Neither situation guarantees a reversal. Instead, both provide additional information about changing market conditions.
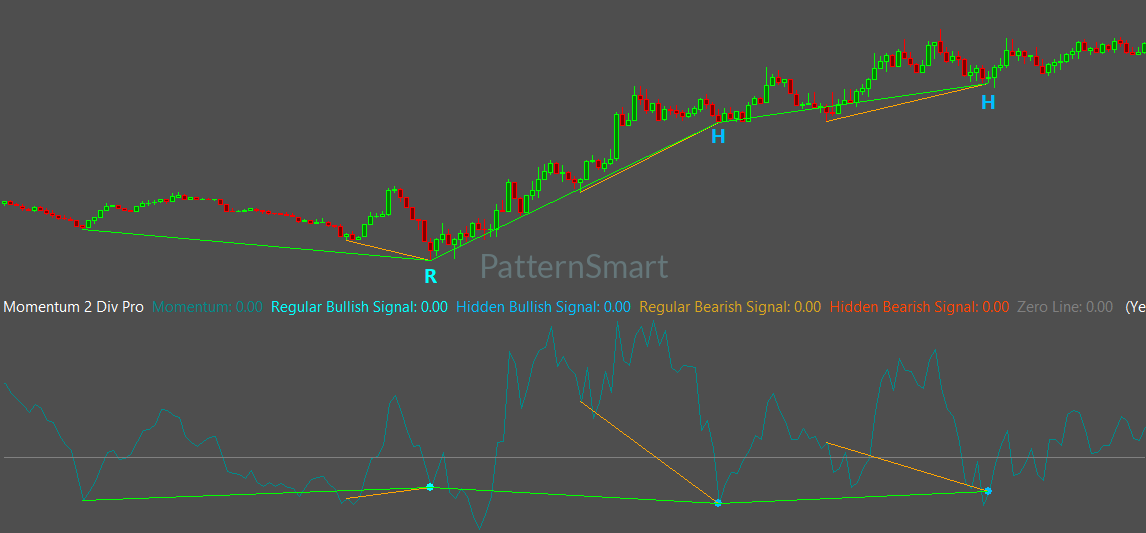
The Double Divergence Approach
A single divergence can occur during a temporary pause in an otherwise strong trend.
This is particularly important with Momentum because its responsiveness can cause divergence to appear relatively early.
PatternSmart therefore applies a confirmation-based Double Divergence methodology.
Rather than treating the first divergence observation as a completed market interpretation, the methodology evaluates whether momentum deterioration develops through additional confirmation stages.
The objective is to distinguish:
Temporary Momentum Deceleration
from
More Persistent Momentum Deterioration
This distinction is central to advanced momentum analysis.
A trader is not simply asking:
“Is there divergence?”
The more useful question is:
“Is the divergence developing in a way that provides meaningful evidence of changing market conditions?”
That shift from signal recognition to evidence evaluation is fundamental to the PatternSmart methodology.
Regular and Hidden Divergence
Momentum Double Divergence supports both Regular Divergence and Hidden Divergence, with four standard classifications.
Bullish Regular Divergence
Bullish Regular Divergence occurs when price makes a lower low while Momentum makes a higher low.
The market is still moving downward, but downside acceleration is weakening.
This can provide early evidence that bearish momentum is deteriorating.
It should be evaluated against market structure and other technical evidence rather than interpreted as an automatic reversal signal.
Bearish Regular Divergence
Bearish Regular Divergence occurs when price makes a higher high while Momentum makes a lower high.
Price continues advancing, but upside acceleration is weakening.
This can provide information about developing momentum deterioration and possible trend exhaustion.
Bullish Hidden Divergence
Bullish Hidden Divergence occurs when price forms a higher low while Momentum forms a lower low.
This relationship can be relevant when analyzing an established bullish trend experiencing a temporary correction.
Rather than focusing exclusively on reversal conditions, Hidden Divergence can provide information about potential continuation within the existing market structure.
Bearish Hidden Divergence
Bearish Hidden Divergence occurs when price forms a lower high while Momentum forms a higher high.
This can be relevant when evaluating an established bearish trend following a temporary upward correction.
The interpretation depends on the prevailing market structure and should always be supported by additional evidence.
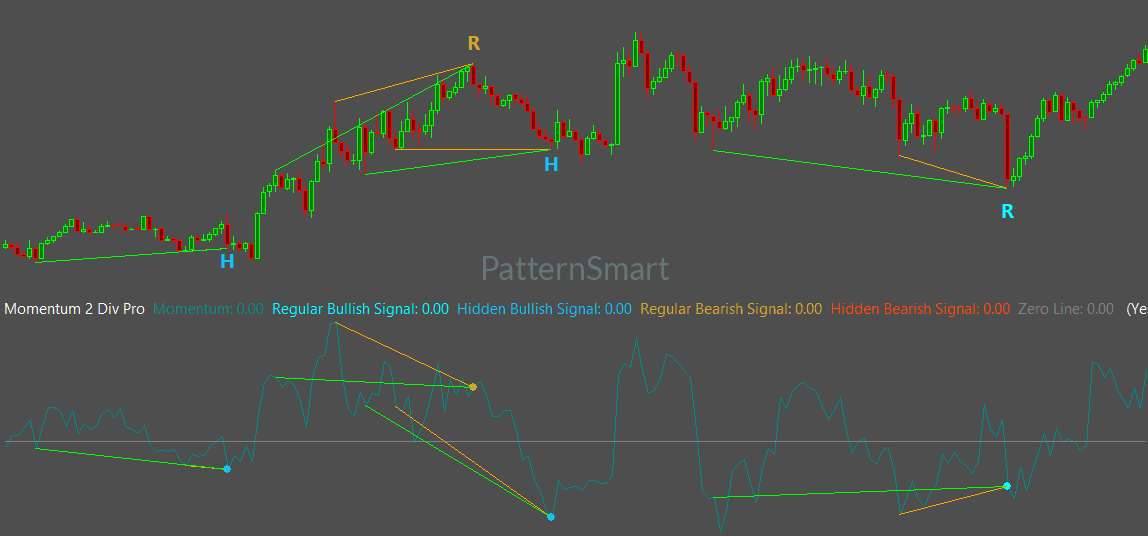
Momentum Acceleration and Deceleration
For experienced traders, one of the most useful ways to approach this indicator is to separate trend direction from trend acceleration.
A rising market does not necessarily have continuously increasing momentum.
Likewise, a declining market does not necessarily have continuously increasing downside acceleration.
A useful analytical sequence is:
Acceleration → Peak Momentum → Deceleration → Momentum Deterioration → Potential Transition
This does not describe a guaranteed sequence of future price behavior. Markets can accelerate again after an initial deceleration.
However, identifying where the market currently sits within this process can improve contextual analysis.
Momentum Double Divergence is particularly relevant when the trader wants to investigate whether an apparent continuation is being supported by progressively weaker price acceleration.
Early Market Transitions
The Momentum version has a specific analytical advantage: responsiveness.
Because Momentum directly evaluates the rate of price change, it can react quickly when market acceleration changes.
This makes it particularly useful for studying:
- Early trend development
- Developing reversals
- Momentum shifts
- Trend exhaustion
- Breakout environments
- Fast-moving markets
The source knowledge base identifies fast-moving markets, developing trend reversals, strong momentum trends, swing markets, and breakout environments as suitable conditions for Momentum Double Divergence.
This responsiveness also creates an important trade-off.
During volatile markets, Momentum may generate more frequent observations and can be more exposed to short-term market noise. Strong trends can also produce early divergence before the trend has actually changed.
Consequently, responsiveness should be combined with confirmation, not treated as a substitute for it.
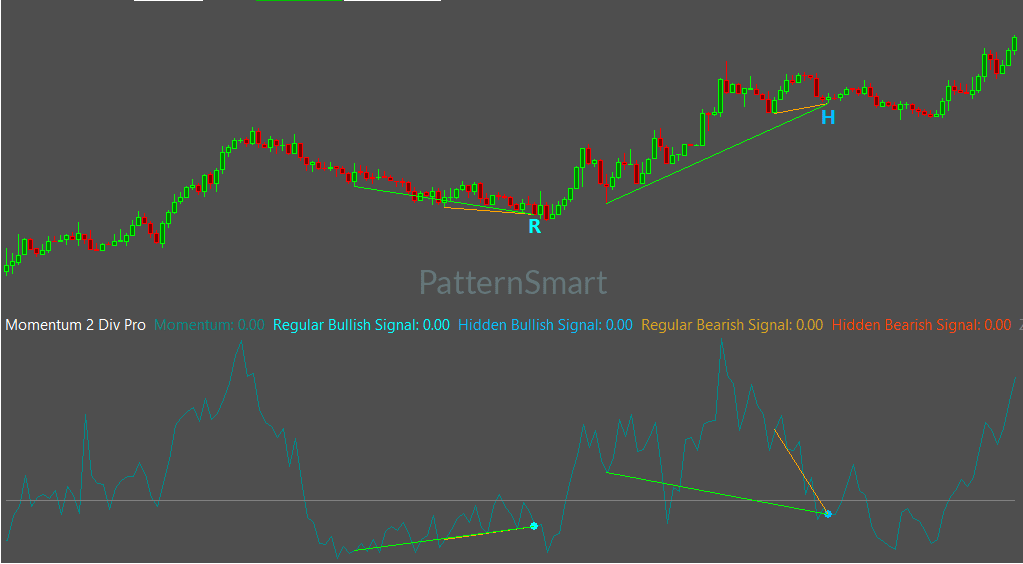
Double Divergence as a Confirmation Framework
The PatternSmart methodology separates signal identification from trading decisions.
Price remains the primary source of information.
The indicator provides additional evidence.
Market structure provides context.
Confirmation helps determine whether the observed relationship deserves greater analytical attention.
This creates a practical framework:
1. Identify the Market Structure
Determine whether price is trending, developing, breaking out, correcting, or moving sideways.
2. Examine Momentum
Evaluate whether price acceleration is increasing, decreasing, or changing character.
3. Identify Divergence
Compare important price highs or lows with corresponding Momentum behavior.
4. Evaluate Double Divergence Confirmation
Determine whether the divergence develops through the required confirmation process.
5. Add Context
Consider support, resistance, price action, and the broader market structure.
6. Form an Independent Interpretation
The final trading decision remains the responsibility of the trader.
This process reflects the PatternSmart principle that confirmation strengthens analytical confidence rather than creating certainty.
Configurable Signal Analysis
Momentum Double Divergence Pro provides controls that allow experienced traders to adapt the indicator to different analytical workflows.
Signal Generation
The indicator includes controls for:
- Wait 1 Bar
- Show Regular Bullish
- Show Regular Bearish
- Show Hidden Bullish
- Show Hidden Bearish
These settings control which divergence types are evaluated and how confirmation timing is handled.
Wait 1 Bar
Wait 1 Bar provides an additional confirmation stage by waiting for the next completed bar before finalizing an eligible signal.
For traders working with fast Momentum behavior, this distinction can be important because earlier divergence does not necessarily mean confirmed divergence.
Enhanced Structural Validation
Enhanced Mode adds an additional structural validation layer before a detected Double Divergence is confirmed.
It is designed to evaluate additional relationships between historical divergence anchor points.
When enabled, signals that satisfy the standard conditions but do not satisfy the additional structural requirements are not confirmed.
The purpose is therefore signal filtering and structural validation, not the creation of a different divergence methodology.
This distinction is particularly relevant for experienced traders who want to separate early Momentum observations from more structurally validated signals.
Advanced Structural Parameters
The Pro version provides three advanced parameters for structural evaluation:
Divergence Bar Range
Defines the structural search boundaries used during divergence evaluation.
Divergence Lookback
Controls the historical swing-point identification process.
Filter Length
Controls internal smoothing during structural evaluation.
These parameters interact with one another during the structural evaluation process. They influence how divergence structures are evaluated, not what the Double Divergence methodology represents.
PatternSmart recommends treating these as calculation and structural-analysis parameters rather than attempting to identify a universally optimal numerical configuration.
Professional Chart Presentation
Experienced traders often maintain complex SierraChart workspaces containing multiple analytical studies.
Momentum Double Divergence Pro provides visualization controls designed to keep divergence information organized within that environment.
Available display features include:
- Show Char
- Show Line
- Only Show Last Signal Within Bars
- Price Line Brush
- Price Line Dash Style
- Price Line Width
These controls affect presentation rather than signal calculation.
For a professional workflow, this separation is important: analytical parameters determine the evaluation process, while visualization settings determine how the resulting information is displayed.
Alerts and Workflow Efficiency
The indicator also provides:
- Enable Alert
- Alert Sound
Alert functions operate after a Double Divergence signal has been confirmed.
They do not influence divergence detection, structural validation, or signal calculation.
This allows alerts to remain a workflow tool rather than becoming part of the analytical decision itself.
Momentum Double Divergence on SierraChart
SierraChart provides a high-performance professional charting environment emphasizing speed, precision, efficient data handling, and analytical flexibility.
This makes it well suited to experienced traders who maintain detailed technical-analysis workspaces and require a responsive charting environment.
Momentum Double Divergence fits naturally into this workflow because its primary analytical purpose is to evaluate rapid changes in price acceleration and developing momentum.
The platform provides the professional charting environment; the PatternSmart methodology remains independent of the platform. The same Double Divergence classification and confirmation principles apply across supported implementations.
Where Momentum Double Divergence Fits
Momentum Double Divergence is particularly relevant for traders focused on:
- Momentum analysis
- Price acceleration
- Price deceleration
- Early trend development
- Developing reversals
- Swing trading
- Momentum trading
- Active discretionary analysis
- Breakout analysis
It can be applied across futures, forex, stocks, cryptocurrencies, commodities, and market indices. Typical analytical timeframes range from 1 Minute through Daily, depending on the market and analytical objective.
Momentum vs. Other Double Divergence Indicators
The distinction between Double Divergence indicators is important.
Momentum focuses on the rate of price change and acceleration.
MACD places greater emphasis on sustained trend development and momentum evolution.
ADX evaluates overall trend strength.
DMI examines directional dominance.
RSI evaluates momentum through recent price gains and losses.
CCI focuses on price deviation from statistical averages.
Money Flow adds information about participation and capital flow.
Each indicator therefore provides a different analytical perspective while using the same underlying confirmation philosophy.
Important Analytical Considerations
Momentum’s responsiveness is both an advantage and an analytical consideration.
A rapid change in Momentum can appear before the broader market structure has changed.
Similarly, divergence can occur during a strong trend and remain unresolved while price continues in the same direction.
For this reason, Momentum Double Divergence should not be interpreted as a standalone reversal mechanism.
A more disciplined approach is to ask:
- Has price acceleration actually deteriorated?
- Is the deterioration persistent?
- Has Double Divergence confirmation developed?
- What does the market structure indicate?
- Where are the important support and resistance levels?
- Is price action providing additional confirmation?
These questions help place the indicator within a broader technical-analysis framework.
PatternSmart — Professional Technical Analysis Software
Explore Momentum Double Divergence Pro for Sierra Chart
Looking for the complete mathematical breakdown, step-by-step optimization guides, and advanced trading strategies? Explore our comprehensive documentation:
Visit the Technical Inputs Manual: Double Divergence Pro for full parameter tuning.
Read the master guide on the Double Divergence Indicator Series.
Frequently Asked Questions
What does Momentum measure?
Momentum measures the rate of price change by comparing current price with price from a previous period. It therefore provides information about price acceleration and deceleration.
Why use Momentum for divergence analysis?
Because Momentum responds directly to changes in price velocity, it can identify momentum deterioration relatively early. This makes it useful for studying developing market transitions.
Does Momentum Double Divergence predict reversals?
No. It provides additional evidence of changing momentum conditions. Confirmation and broader market context remain essential.
What is the difference between Regular and Hidden Divergence?
Regular Divergence is commonly used when evaluating potential trend exhaustion and reversal conditions. Hidden Divergence provides information that may be relevant to continuation within an existing market structure.
Can Momentum divergence appear too early?
Yes. Momentum is responsive, so divergence can appear before a trend actually changes. This is one reason the Double Divergence confirmation process is important.
Is Momentum suitable for fast markets?
The source knowledge base identifies fast-moving and momentum-driven markets among the conditions where the Momentum version can be useful. However, increased volatility can also produce more frequent signals and short-term noise.
What is Enhanced Mode?
Enhanced Mode adds an additional structural validation layer before a detected Double Divergence signal is confirmed. It is a filtering mechanism, not a separate methodology.
Does changing advanced parameters change the methodology?
No. Parameters such as Divergence Bar Range, Divergence Lookback, and Filter Length influence structural evaluation, but they do not change the underlying Double Divergence methodology.
Conclusion
Momentum Double Divergence provides a focused perspective on rate of price change, acceleration, deceleration, momentum deterioration, and early market transitions.
Its primary advantage is responsiveness. It can reveal changes in price acceleration while the broader price trend is still developing.
Its primary analytical challenge is the same characteristic: early momentum deterioration does not necessarily produce an immediate trend reversal.
The PatternSmart Double Divergence methodology addresses this by emphasizing confirmation rather than prediction.
For experienced SierraChart users, Momentum Double Divergence Pro provides a structured framework for incorporating this analysis into a professional technical-analysis workflow, with configurable signal generation, structural filtering, advanced evaluation parameters, visualization controls, and alerts.
The central analytical principle is straightforward:
Do not ask only whether price is moving. Examine how quickly it is moving, whether that rate is changing, and whether the change receives sufficient confirmation within the broader market structure.
That perspective can make Momentum a valuable component of a disciplined approach to analyzing developing trends, momentum shifts, and early market transitions.