Analyze Buying Pressure, Selling Pressure, and Market Participation
Money Flow Double Divergence Pro for Sierra Chart combines Money Flow analysis with the PatternSmart Double Divergence methodology to provide another perspective on what may be supporting or weakening a price trend.
Price tells you what the market is doing. Money Flow adds a different question:
Is buying or selling pressure supporting the price movement?
This distinction can be especially useful when price continues moving in one direction while underlying market participation begins to change.
Money Flow Double Divergence is designed to help traders examine these relationships through capital flow, buying pressure, selling pressure, and market participation. Double Divergence adds a structured confirmation process so that traders can evaluate changing participation rather than reacting to one isolated divergence observation.
The result is a technical-analysis tool that can complement price action and help organize additional evidence when evaluating developing market conditions.
What Is Money Flow?
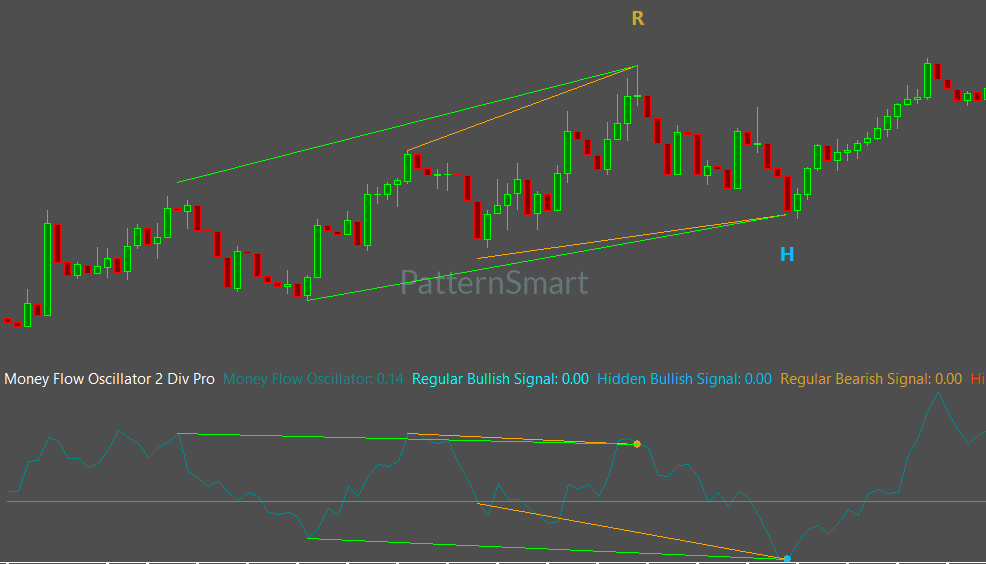
Money Flow is an analytical approach that evaluates the relationship between price movement and trading activity.
It provides information about whether buying or selling pressure appears to support the prevailing price movement.
This makes Money Flow different from a pure price-based indicator.
A price chart may show a strong upward move, for example. Money Flow can provide another perspective by examining whether the underlying participation is consistent with that advance.
Similarly, price may continue declining while selling pressure begins to change.
The purpose is not to determine exactly what every market participant is doing. Instead, Money Flow provides an additional analytical perspective on participation and market conviction.
The PatternSmart indicator knowledge base specifically emphasizes that Money Flow should not be presented merely as a volume indicator. Its primary focus is the relationship between price movement, trading activity, and buying or selling pressure.
Why Market Participation Matters
A price trend can be viewed from several different perspectives.
Price tells you the direction and structure of movement.
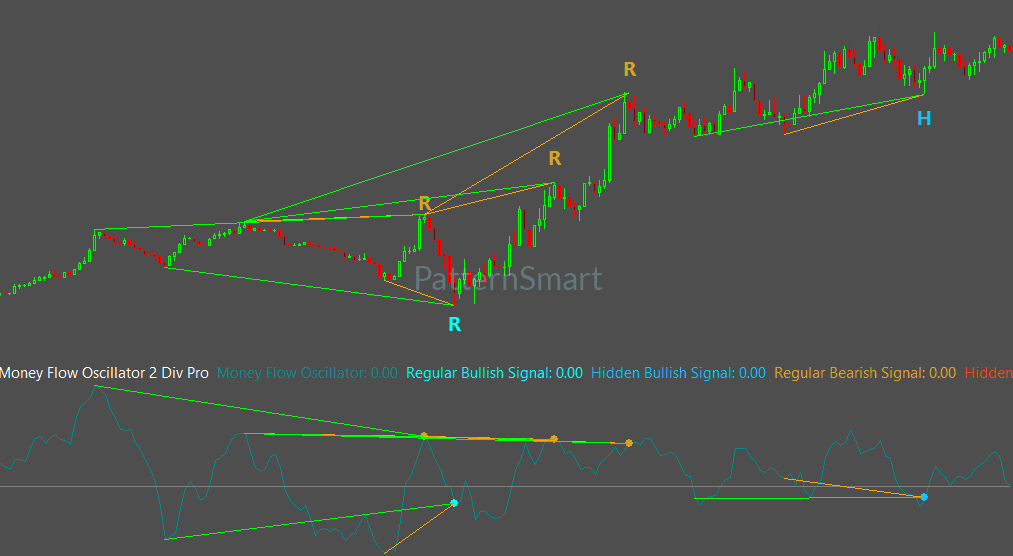
Money Flow provides information about participation behind that movement.
Consider an established bullish trend.
Price continues making higher highs. On the surface, the trend remains intact.
However, if Money Flow begins showing weaker participation while price continues advancing, the two sources of information are no longer fully aligned.
That difference may deserve attention.
It does not mean the trend must reverse.
The market may continue higher, consolidate, or eventually transition into a different condition.
Money Flow simply provides additional evidence that can help traders evaluate whether the existing price movement continues to receive the same level of underlying buying pressure.
What Is Divergence?
Divergence occurs when price and an indicator begin moving differently.
For example, price may make a new high while Money Flow fails to make a corresponding high.
Price is still advancing, but the participation measure is not confirming the move to the same degree.
This is a form of Bearish Regular Divergence.
The opposite situation can occur when price makes a new low while Money Flow forms a higher low. This can be considered Bullish Regular Divergence.
Divergence is information, not prediction.
It identifies a difference between price behavior and the behavior measured by the selected indicator. That difference then becomes something to evaluate within the broader market context.
What Makes It Double Divergence?
A single divergence can occur during an otherwise healthy trend.
For example, buying pressure may temporarily weaken while the market continues advancing.
This is why PatternSmart does not treat divergence as an automatic reversal mechanism.
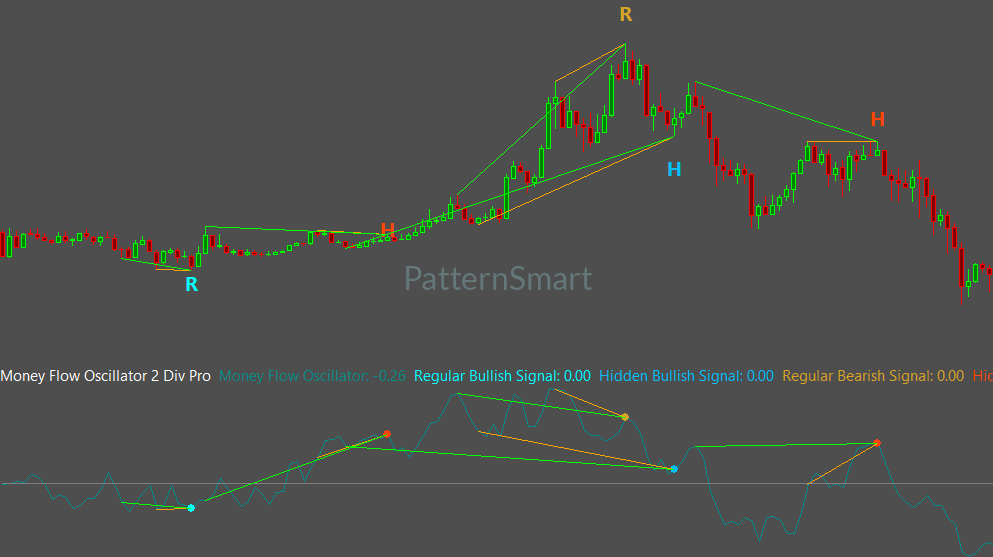
The Double Divergence methodology emphasizes confirmation.
Instead of relying on one technical event, it provides a structured framework for evaluating whether the relationship between price and the indicator develops through additional confirmation.
The general analytical process is:
Observe → Compare → Confirm → Interpret → Evaluate
The purpose is to improve the interpretation of present market conditions—not to predict the future with certainty.
Understanding the Four Money Flow Divergence Types
Money Flow Double Divergence uses four standard signal classifications.
Bullish Regular Divergence
Price forms a Lower Low, while Money Flow forms a Higher Low.
The market is moving lower, but underlying buying and selling pressure is showing less agreement with the new price low.
This may indicate weakening selling pressure or changing participation.
It deserves evaluation alongside price structure and other technical evidence.
Bearish Regular Divergence
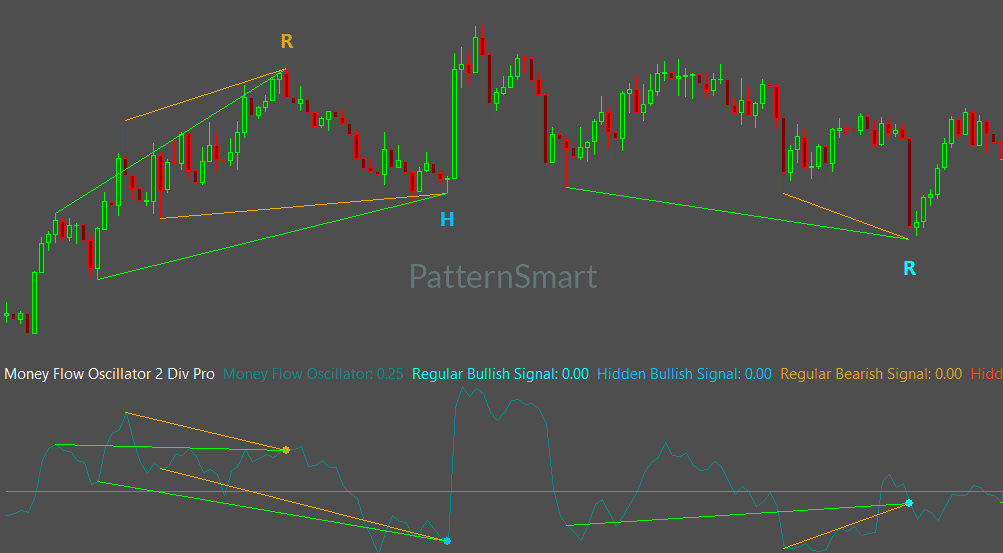
Price forms a Higher High, while Money Flow forms a Lower High.
Price continues advancing, but the underlying participation measure is weaker.
This may suggest that buying pressure is not supporting the latest price advance to the same degree.
Again, it is an observation rather than a guaranteed reversal signal.
Bullish Hidden Divergence
Price forms a Higher Low, while Money Flow forms a Lower Low.
This type of divergence can be relevant when an established bullish market experiences a temporary correction.
It provides additional information for evaluating whether the broader bullish structure remains consistent with underlying participation.
Bearish Hidden Divergence
Price forms a Lower High, while Money Flow forms a Higher High.
This can be relevant when an established bearish market experiences a temporary upward correction.
The observation may contribute to an evaluation of whether bearish conditions remain supported by the broader market structure.
The same divergence classification can have different significance in different environments. Context always matters.
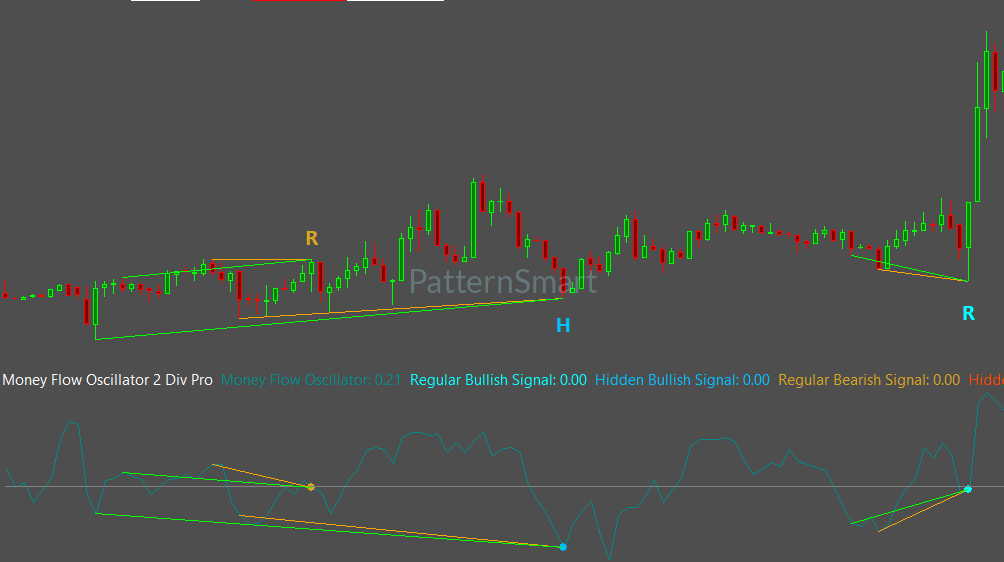
Capital Flow and Market Conviction
One of the most useful ways to understand Money Flow is through the concept of market conviction.
When price moves strongly and participation supports that movement, the technical picture may appear more internally consistent.
When price continues moving but participation begins weakening, the market may deserve closer examination.
This does not mean that weakening participation automatically produces a reversal.
Instead, it raises an analytical question:
Is the current price movement still receiving sufficient participation to maintain its existing character?
That question makes Money Flow particularly useful as a confirmation tool.
It can complement other forms of technical evidence rather than duplicate them.
When Money Flow Double Divergence Is Most Useful
The PatternSmart knowledge base identifies several conditions where Money Flow analysis can be particularly relevant:
- Markets with reliable volume information
- Trending markets
- High-liquidity markets
- Markets with meaningful participation
It is also suited to analytical approaches involving:
- Swing trading
- Position trading
- Volume-based analysis
- Capital-flow analysis
- Institutional-style analysis
The quality of volume information is an important consideration. Money Flow becomes less meaningful when the available volume data does not provide a reliable representation of market activity.
Confirmation Is More Important Than a Single Signal
Professional technical analysis rarely depends on one observation.
The PatternSmart methodology places price action first and treats indicators as additional analytical evidence.
A practical workflow is:
1. Examine price structure.
Identify the prevailing trend, recent highs and lows, and important market levels.
2. Examine Money Flow.
Consider whether participation appears consistent with the price movement.
3. Identify divergence.
Compare important price turning points with corresponding Money Flow behavior.
4. Evaluate confirmation.
Look for additional evidence from price action, market structure, support and resistance, volatility, or higher-timeframe analysis.
5. Interpret the complete picture.
Use the divergence as part of a broader analytical process.
Confirmation can increase analytical confidence, but it does not create certainty.
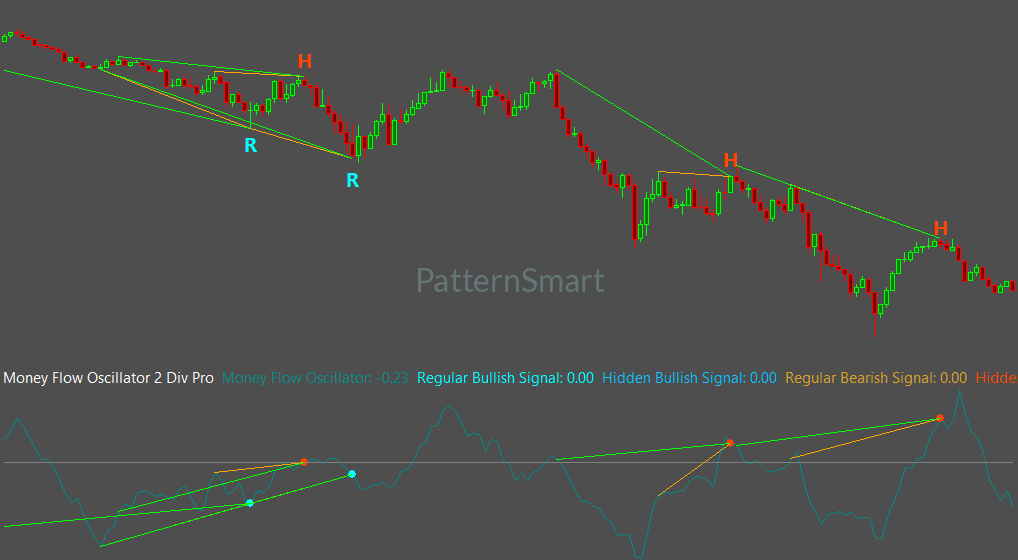
Money Flow Double Divergence Pro Features
The Pro version provides configurable controls for signal selection, confirmation, structural evaluation, alerts, and visualization.
Signal Selection
The indicator includes:
- Show Regular Bullish
- Show Regular Bearish
- Show Hidden Bullish
- Show Hidden Bearish
These controls allow traders to determine which divergence classifications are displayed.
Wait 1 Bar
Wait 1 Bar adds one completed bar before a detected divergence signal is finalized.
When enabled, the next bar must completely close before confirmation. This provides an additional confirmation stage and can help reduce premature signal confirmation.
Enhanced Mode
Enhanced Mode provides an additional structural validation layer.
It evaluates additional structural relationships before an otherwise eligible Double Divergence signal is confirmed.
It does not create a separate divergence methodology.
Advanced Parameters
Three parameters provide additional control over structural evaluation:
- Divergence Bar Range — defines the structural search boundaries.
- Divergence Lookback — controls historical swing-point identification.
- Filter Length — controls internal smoothing during structural evaluation.
These parameters influence how divergence structures are evaluated, rather than changing the underlying methodology.
Clear Visualization and Alerts
Money Flow Double Divergence Pro includes visualization controls such as:
- Show Char
- Show Line
- Only Show Last Signal Within Bars
- Price Line Brush
- Price Line Dash Style
- Price Line Width
These features control how confirmed signals are presented on the chart.
The indicator also includes Enable Alert and Alert Sound for notification management. Alerts operate after a signal has been confirmed and do not influence signal generation or filtering.
Designed for Sierra Chart
Sierra Chart is a high-performance professional charting environment recognized for speed, efficiency, precision, and analytical flexibility.
Its user base includes professional futures traders, order-flow traders, advanced technical analysts, and performance-oriented traders.
For these users, Money Flow Double Divergence can add a participation-focused analytical layer to an existing charting workflow.
The platform provides the professional charting environment, while the Double Divergence methodology remains consistent across supported platforms.
A Practical Example
Imagine a futures market that has been trending upward for several sessions.
Price makes another new high.
At first glance, the trend appears healthy.
However, Money Flow does not make a corresponding new high. The latest advance is occurring with weaker underlying participation.
This creates a potential Bearish Regular Divergence observation.
A disciplined analysis does not immediately assume that price will reverse.
Instead, the trader asks:
- Is the broader trend still intact?
- Is the divergence confirmed?
- Is price approaching significant resistance?
- Has market structure changed?
- Is participation continuing to weaken?
- Does another timeframe provide supporting evidence?
The answers to these questions determine how meaningful the divergence may be.
This is the practical role of Money Flow Double Divergence: organizing additional evidence around changing participation rather than replacing price analysis.
PatternSmart — Professional Technical Analysis Software
Explore MoneyFlow Double Divergence Pro for Sierra Chart
Looking for the complete mathematical breakdown, step-by-step optimization guides, and advanced trading strategies? Explore our comprehensive documentation:
Visit the Technical Inputs Manual: Double Divergence Pro for full parameter tuning.
Read the master guide on the Double Divergence Indicator Series.
Frequently Asked Questions
Is Money Flow the same as volume?
Not exactly. Money Flow evaluates the relationship between price movement and trading activity. PatternSmart specifically positions it around buying pressure, selling pressure, capital flow, and participation rather than treating it as a pure volume indicator.
What does Money Flow divergence tell me?
It identifies situations where price movement and underlying participation are becoming less consistent. This may provide information about changing market conviction.
Does Money Flow divergence predict a reversal?
No. Divergence is an analytical observation. A reversal may or may not follow, which is why confirmation and market context remain important.
Which markets are suitable for Money Flow Double Divergence?
It is particularly relevant to markets where volume information is reliable, including trending and high-liquidity environments.
What is the purpose of Hidden Divergence?
Hidden Divergence can provide information about continuation conditions when price temporarily moves against an established trend.
What does Enhanced Mode do?
Enhanced Mode applies additional structural validation to eligible Double Divergence signals before they are confirmed.
Conclusion
Money Flow provides an important analytical perspective that price alone cannot provide: the relationship between price movement and market participation.
By examining buying pressure, selling pressure, capital flow, and market conviction, traders can investigate whether participation remains consistent with the prevailing price trend.
Double Divergence adds a confirmation-based framework to this analysis, helping traders evaluate whether differences between price and participation develop into meaningful technical evidence.
For Sierra Chart users, Money Flow Double Divergence Pro integrates this participation-focused analysis into a high-performance professional charting environment.
The central idea is straightforward:
Price shows where the market is moving. Money Flow provides another perspective on the participation behind that movement. Double Divergence helps organize and confirm differences between the two.
Used within a broader technical-analysis process, this can provide a more structured way to study market participation, changing buying and selling pressure, and the consistency of major price movements.