RSI Double Divergence for Sierra Chart helps traders analyze momentum shifts, divergence, reversal potential, and market context through a structured confirmation-based technical analysis methodology.
Understanding why price continues to move while momentum begins to change can provide valuable insight into market behavior. RSI Double Divergence for Sierra Chart is designed to help traders study this relationship by combining RSI momentum analysis with a structured Double Divergence methodology.
Rather than treating divergence as an automatic reversal signal, the indicator provides additional technical evidence that can be evaluated alongside price action, market structure, support and resistance, and other forms of confirmation.
For traders using Sierra Chart, this creates a structured way to examine momentum shifts while maintaining the precision, efficiency, and flexibility associated with a professional charting environment.
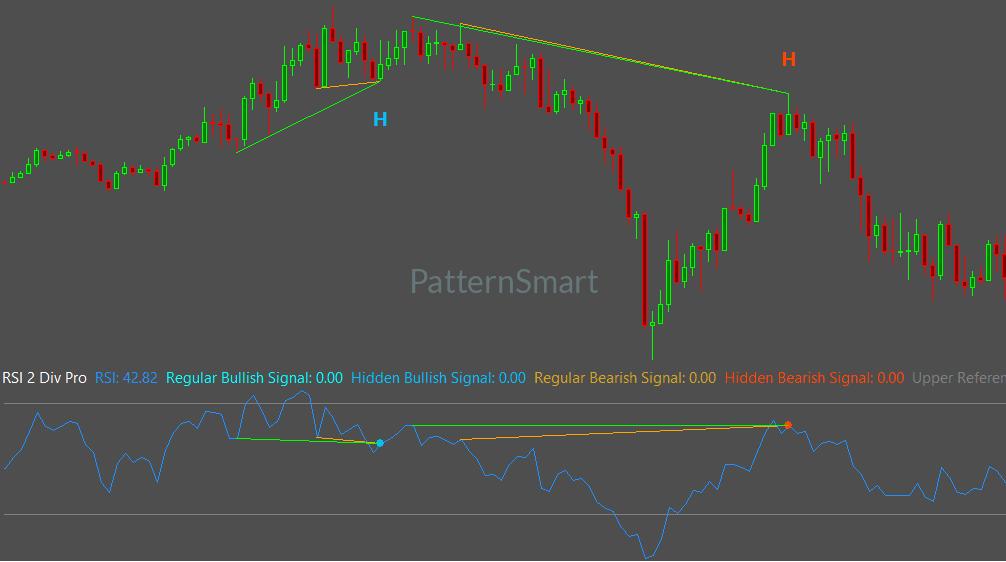
What Is RSI?
The Relative Strength Index (RSI) is a momentum indicator used to evaluate the speed and magnitude of recent price movement.
Momentum describes how strongly and quickly price is moving. A market can continue rising while its upward momentum begins to weaken, or continue falling while downward momentum starts to lose strength.
RSI provides another perspective on these changes.
For example, imagine a market that makes a new price high. If RSI does not reach a corresponding new high, the relationship between price and momentum has changed. Price is still moving upward, but the momentum behind that movement may not be developing at the same rate.
This is one of the situations where divergence analysis becomes useful.
RSI should therefore not be viewed only as an overbought or oversold indicator. Its more important role within Double Divergence analysis is helping traders evaluate momentum shifts, momentum exhaustion, reversal potential, and changing market psychology.
What Is Divergence?
Divergence occurs when price and an indicator are no longer moving in agreement.
A simple way to understand the concept is:
Price moves in one direction → RSI behaves differently → the relationship deserves further evaluation.
Divergence does not predict what will happen next. It simply identifies a difference between price behavior and indicator behavior.
The PatternSmart methodology treats divergence as information rather than prediction. Price action remains the primary source of information, while the indicator provides an additional analytical perspective.
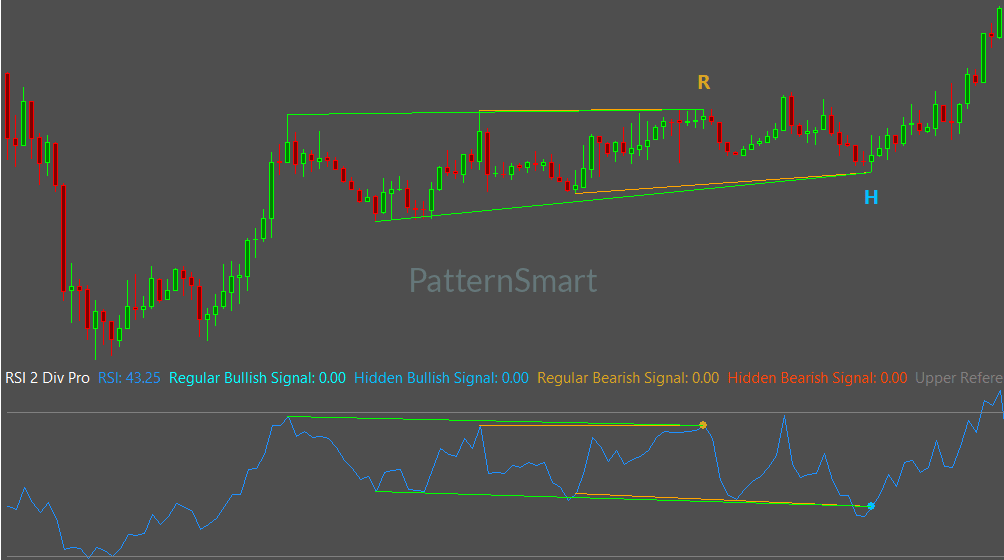
Understanding the Four RSI Divergence Types
RSI Double Divergence organizes divergence into four primary categories.
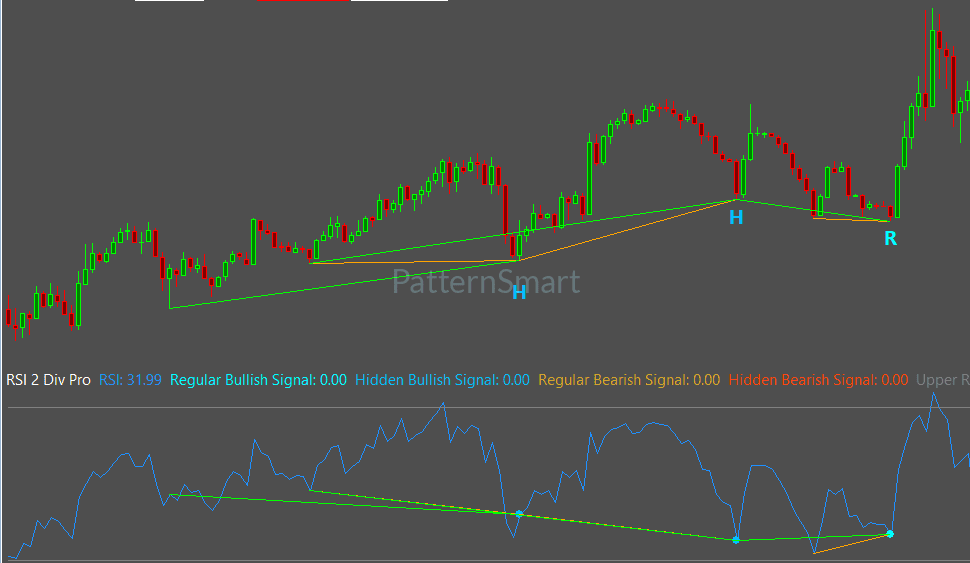
Bullish Regular Divergence
Bullish Regular Divergence occurs when:
- Price forms a lower low
- RSI forms a higher low
Price has moved lower, but RSI has not confirmed the same degree of downward momentum.
This may provide evidence that bearish momentum is changing and that the current downward movement deserves closer examination. It does not, by itself, establish that a reversal will occur.
Bearish Regular Divergence
Bearish Regular Divergence occurs when:
- Price forms a higher high
- RSI forms a lower high
Price has reached a new high, while RSI has failed to match the previous momentum level.
This may suggest that upward momentum is weakening and that the existing bullish movement deserves additional evaluation.
Bullish Hidden Divergence
Bullish Hidden Divergence occurs when:
- Price forms a higher low
- RSI forms a lower low
This type of divergence is commonly associated with pullbacks within an existing bullish environment.
Rather than primarily questioning the trend, Bullish Hidden Divergence may provide evidence that the broader bullish condition remains intact despite temporary weakness.
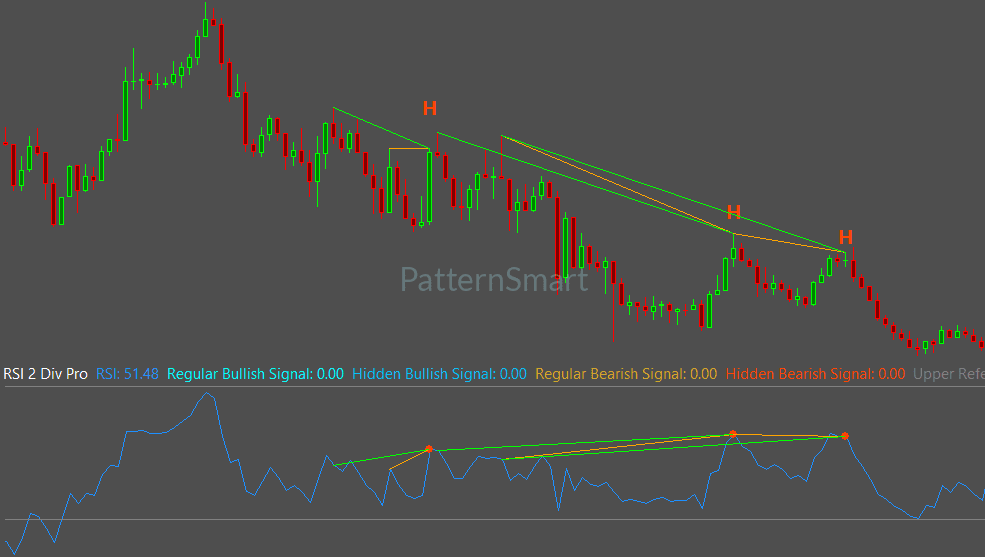
Bearish Hidden Divergence
Bearish Hidden Divergence occurs when:
- Price forms a lower high
- RSI forms a higher high
This can occur during a temporary upward correction within a broader bearish environment.
The observation may suggest that bearish conditions remain technically consistent despite the temporary price recovery.
Why Double Divergence Uses Confirmation
One of the most important concepts for beginners is that a divergence signal is not a complete trading decision.
The PatternSmart Double Divergence methodology is confirmation-based. The objective is to combine several observations rather than immediately react to one technical event.
A practical analytical process can be viewed as:
Observation → Verification → Confirmation → Interpretation → Decision
After an RSI divergence appears, traders can examine questions such as:
- What is the current trend?
- Is the market trending or consolidating?
- Where is the signal occurring within the broader price structure?
- Is there nearby support or resistance?
- Does price action provide additional confirmation?
- Does the higher timeframe support the same interpretation?
Confirmation can come from price action, trend structure, support and resistance, volatility, market structure, or higher-timeframe analysis.
This approach helps prevent a common beginner mistake: treating every divergence as something that must immediately result in a trade.
RSI Double Divergence Features
RSI Double Divergence for Sierra Chart provides configurable controls for both analytical evaluation and chart presentation.
RSI Period
The RSI Period controls the period used for the RSI calculation. The Sierra Chart implementation provides a default RSI Period of 14.
Understanding this setting is important because RSI is the foundation of the indicator’s momentum analysis. Different periods can produce different momentum perspectives.
Divergence Bar Range
Divergence Bar Range defines the structural search boundaries used when evaluating divergence. The available choices are:
- ShortRange
- MidRange
- LongRange
ShortRange examines more compact structures, while MidRange and LongRange allow broader historical relationships to be evaluated.
Divergence Lookback
Divergence Lookback controls how many historical bars are considered when identifying local swing points.
A larger value generally requires larger structural movement before a swing point is recognized, while a smaller value allows smaller movements to qualify.
The default value is 5.
Filter Length
Filter Length controls the internal smoothing used during structural evaluation.
Increasing the value produces smoother structural evaluation, while reducing it produces more responsive structural evaluation. These settings influence how divergence structures are evaluated; they do not change the underlying Double Divergence methodology.
Wait 1 Bar
Wait 1 Bar is designed to add a confirmation step before a signal is finalized. The Sierra Chart implementation provides this option as a configurable setting.
This is particularly useful for understanding the difference between identifying a potential divergence structure and confirming the resulting signal.
Enhanced Mode
Enhanced Mode provides additional structural validation after a divergence structure has been identified.
It should not be confused with Wait 1 Bar. Wait 1 Bar relates to confirmation timing, while Enhanced Mode applies additional validation to an eligible signal.
Clear Chart Visualization
Technical analysis becomes more useful when information can be interpreted efficiently.
RSI Double Divergence includes Show Char and Show Line controls. These allow traders to choose whether signal labels and divergence lines are displayed.
The Only Show Last Signal Within Bars setting can also help reduce nearby historical signals and improve chart readability.
Line color, line style, and line width can be adjusted for the divergence lines. Importantly, these are presentation settings: changing them does not alter divergence detection or signal timing.
Alerts for Confirmed Signals
For traders who monitor several charts, Enable Alert provides a way to receive notifications after a signal has been confirmed.
Alert settings operate separately from signal calculation. They do not create or filter divergence signals; their purpose is to communicate confirmed events efficiently.
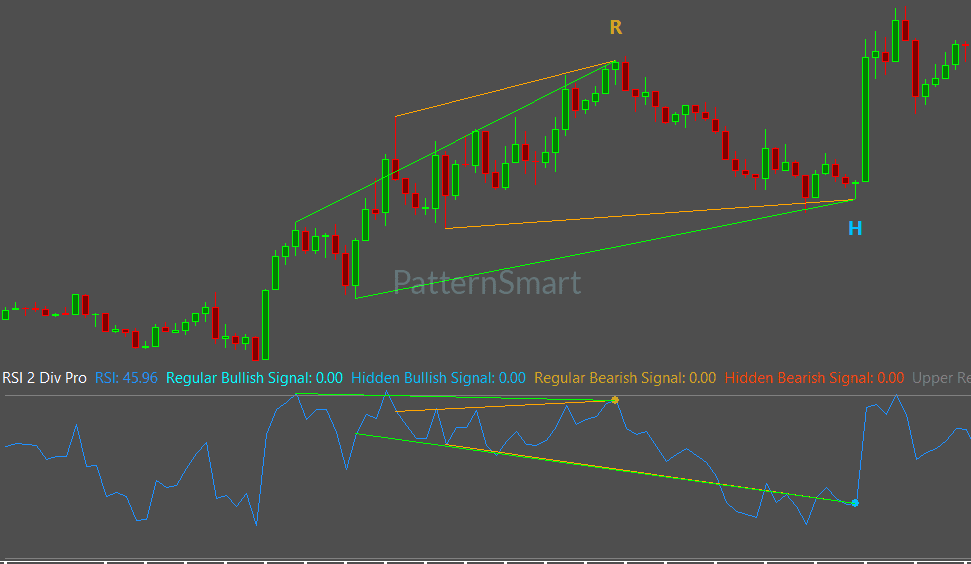
RSI Double Divergence and Sierra Chart
Sierra Chart is a high-performance professional charting platform recognized for speed, efficiency, precision, and analytical flexibility. It is commonly used by futures traders, order flow traders, and technical analysts who value detailed chart analysis.
RSI Double Divergence fits naturally into this environment by adding structured momentum and divergence analysis to an existing professional charting workflow.
The platform changes the working environment, but it does not change the Double Divergence methodology. The same divergence classifications and confirmation principles apply across PatternSmart’s supported platforms.
A Simple Beginner Workflow
A beginner can approach RSI Double Divergence through a straightforward process:
1. Start with price.
Identify the current trend, recent highs and lows, and important market structure.
2. Examine RSI.
Look at how momentum behaves as price approaches significant highs or lows.
3. Identify the divergence type.
Determine whether the observation is Bullish Regular, Bearish Regular, Bullish Hidden, or Bearish Hidden Divergence.
4. Evaluate context.
Consider whether the market is trending, ranging, pulling back, or approaching an important price area.
5. Seek confirmation.
Look for supporting evidence from price action or other relevant technical information.
6. Make an independent decision.
Use the complete body of evidence rather than relying on divergence alone.
This workflow keeps the emphasis on understanding market behavior instead of simply reacting to indicator signals.
Who Can Use RSI Double Divergence?
RSI Double Divergence is particularly relevant to traders interested in:
- Momentum analysis
- Reversal analysis
- Swing trading
- Short-term technical analysis
- Momentum exhaustion
- Multi-timeframe analysis
It can be applied across different markets and chart environments, but RSI divergence may produce numerous observations during strong trends. Market context and price confirmation therefore remain important.
PatternSmart — Professional Technical Analysis Software
Explore RSI Double Divergence Pro for Sierra Chart
Looking for the complete mathematical breakdown, step-by-step optimization guides, and advanced trading strategies? Explore our comprehensive documentation:
Visit the Technical Inputs Manual: Double Divergence Pro for full parameter tuning.
Read the master guide on the Double Divergence Indicator Series.
Frequently Asked Questions
Is RSI Double Divergence a reversal indicator?
It can help identify conditions associated with potential reversals, particularly through Regular Divergence. However, divergence is analytical evidence rather than a guaranteed reversal signal.
What is the difference between Regular and Hidden Divergence?
Regular Divergence is commonly used to evaluate potential weakening of the existing price movement. Hidden Divergence is commonly associated with continuation following a pullback or correction.
Should I trade every RSI divergence?
No. The PatternSmart methodology emphasizes confirmation and market context. A divergence should be evaluated as part of a broader analytical process.
Can RSI Double Divergence be used for futures?
Yes. Sierra Chart is commonly associated with professional futures analysis, and RSI Double Divergence can be incorporated into futures chart analysis.
Do visualization settings change the signals?
No. Settings such as Show Line, Show Char, line appearance, and Only Show Last Signal Within Bars affect presentation rather than the underlying analytical results.
Conclusion
RSI Double Divergence provides a structured way to study the relationship between price and momentum.
Instead of asking only whether price is rising or falling, traders can also examine whether RSI is supporting the movement. When the two begin behaving differently, divergence provides additional technical information that may deserve closer analysis.
The key is interpretation. RSI divergence does not predict the future, and no individual signal should replace price analysis or independent judgment. By combining RSI observations with market structure, price action, and confirmation, traders can develop a more organized approach to understanding momentum shifts and potential changes in market behavior.
For Sierra Chart users, RSI Double Divergence brings this confirmation-oriented methodology into a high-performance, precision-focused charting environment, providing another analytical perspective within an established technical workflow.