Understanding Price Deviation, Market Extremes, and Divergence
Technical analysis becomes more useful when traders can look beyond simple price direction. A market can continue making new highs or lows while the underlying behavior begins to change. Recognizing this difference can provide additional information when evaluating whether an extended move is still being supported.
The CCI Double Divergence Indicator for MultiCharts .NET is designed around this idea. It combines the analytical perspective of the Commodity Channel Index (CCI) with the PatternSmart Double Divergence methodology to help traders examine the relationship between price movement and price deviation.
Rather than attempting to predict what the market will do next, the indicator provides additional technical evidence that can be considered alongside price action, market structure, and other forms of confirmation.
What Is CCI?
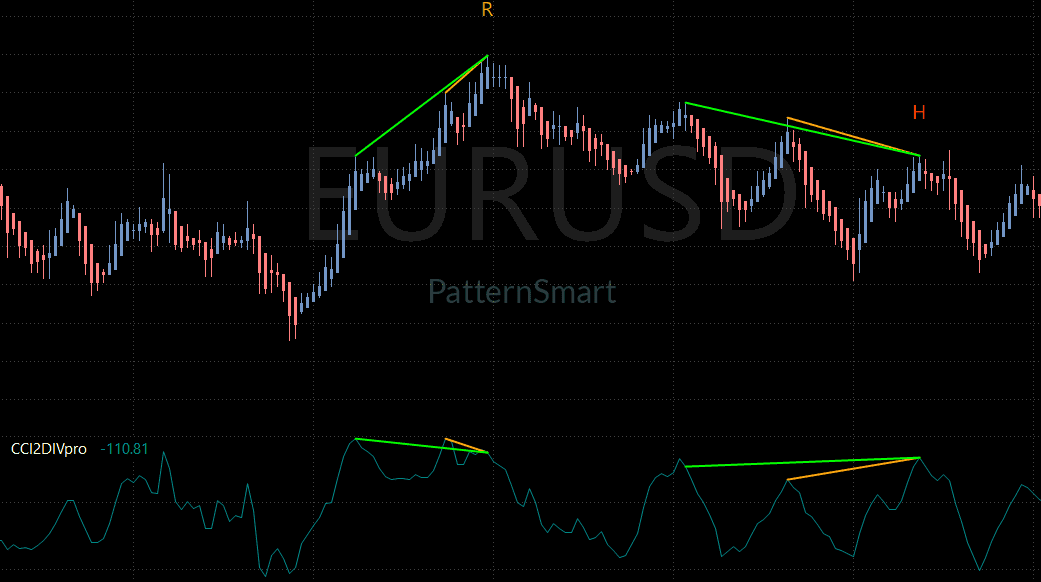
CCI, or Commodity Channel Index, is a technical indicator that measures how far price has moved away from its statistical average.
In simple terms, CCI helps answer an important question:
How far has the current price moved from what has been typical recently?
When price moves significantly away from its average, CCI can reflect that extended movement. This makes CCI useful when studying market extremes, cyclical behavior, and situations where price may be moving unusually far from its recent norm.
However, an extended CCI reading does not automatically mean that price must reverse. Markets can remain extended for considerable periods, particularly during powerful trends.
This is why context matters.
CCI Double Divergence adds another layer of analysis by comparing CCI behavior with actual price movement. The goal is not simply to identify an extreme reading, but to examine whether price continues to receive the same underlying support suggested by the indicator.
What Is Double Divergence?
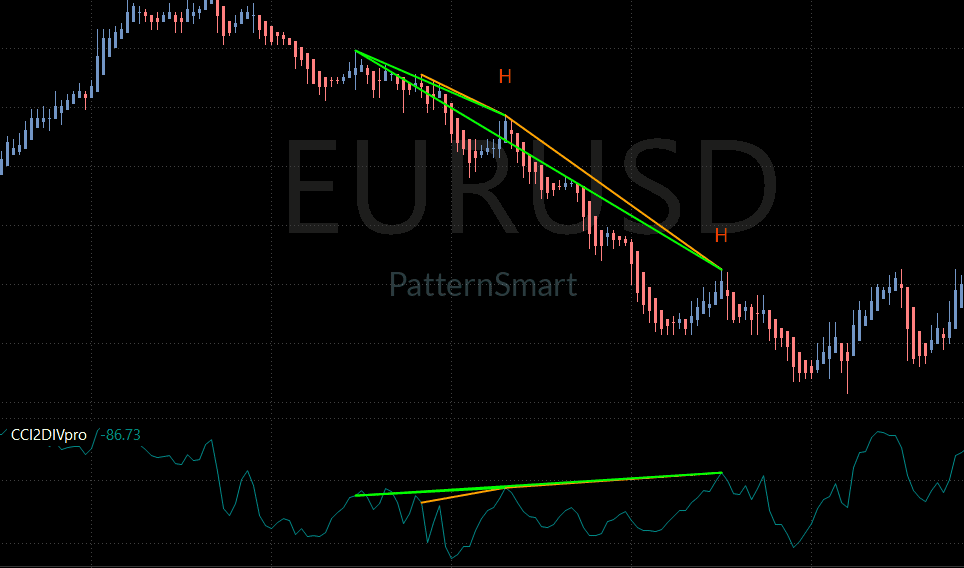
Divergence occurs when price and an indicator are no longer moving in complete agreement.
For example, price may make a new high while the indicator fails to make a corresponding new high. This difference can suggest that the current price movement deserves closer examination.
The PatternSmart Double Divergence methodology uses a confirmation-based approach. It encourages traders to observe price, compare it with indicator behavior, consider market context, and then seek additional confirmation before forming an interpretation.
The methodology can be summarized simply:
Observe → Compare → Confirm → Interpret → Evaluate
This process is important because divergence is information, not a prediction. A divergence signal does not guarantee a reversal, and it should not be treated as an automatic buy or sell signal.
Understanding the Four Divergence Types
CCI Double Divergence organizes observations into four standard categories: Bullish Regular Divergence, Bearish Regular Divergence, Bullish Hidden Divergence, and Bearish Hidden Divergence.
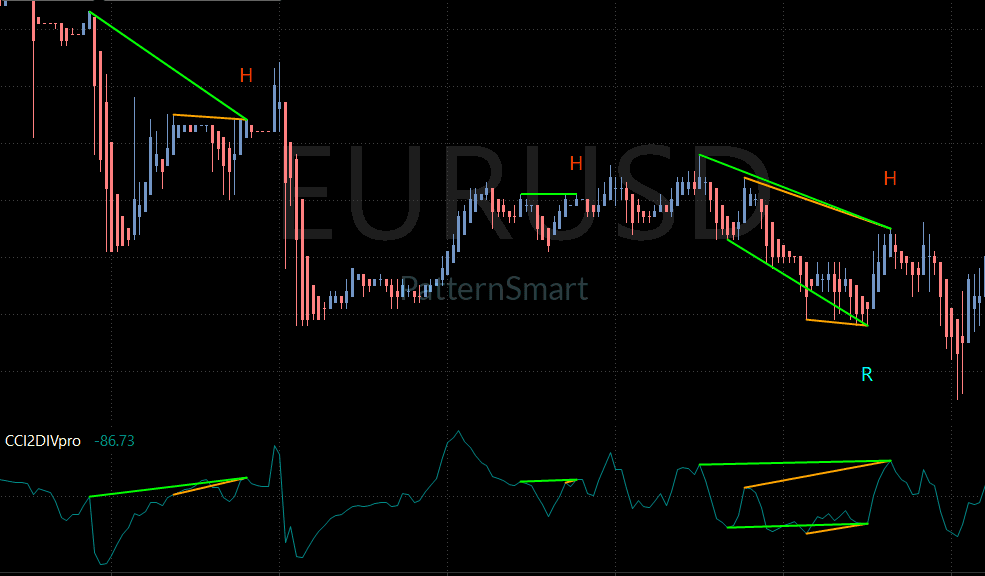
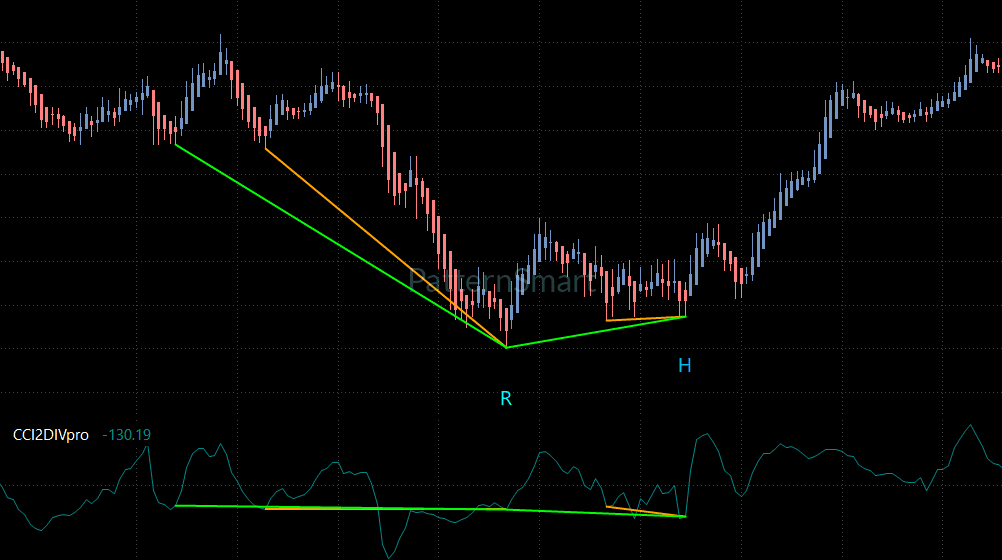
Bullish Regular Divergence occurs when price makes a lower low while the indicator makes a higher low. This can provide evidence that bearish conditions are changing and that the latest downward movement is not receiving the same level of support from the indicator.
Bearish Regular Divergence occurs when price makes a higher high while the indicator makes a lower high. This may indicate that bullish conditions deserve closer examination.
Hidden divergence has a different purpose. Rather than primarily questioning an existing trend, hidden divergence can provide information about possible trend continuation following a temporary correction.
Bullish Hidden Divergence occurs when price makes a higher low while the indicator makes a lower low. In an established bullish environment, this may suggest that the broader bullish condition remains supported despite temporary weakness.
Bearish Hidden Divergence occurs when price makes a lower high while the indicator makes a higher high. In a bearish environment, this may indicate that the broader bearish condition remains technically consistent despite a temporary upward move.
The important point for beginners is that these classifications describe market observations. They do not rank signals or guarantee an outcome.
Why CCI Is Useful for Double Divergence Analysis
CCI brings a distinctive perspective to the Double Divergence methodology because it focuses on price deviation from a statistical average.
This makes CCI Double Divergence particularly relevant when studying:
Market extremes
Extended price movements
Cyclical market behavior
Mean-reversion conditions
Potential changes in market normalization
CCI divergence can develop when price reaches an extended condition while CCI behavior begins to normalize. This difference may provide useful information about whether the current price movement is continuing with the same underlying support.
CCI can be particularly useful in range-bound or cyclical markets and when price has experienced an extended movement. At the same time, CCI divergence can be less effective when a market is experiencing a very powerful trend. Broader market context and confirmation therefore remain important.
Using CCI Double Divergence in MultiCharts .NET
MultiCharts .NET is a development-oriented environment that supports C# implementation, object-oriented development, customization, quantitative research, and professional software design. It is commonly associated with quantitative traders, developers, system designers, and users building structured analytical environments.
For traders working in this environment, CCI Double Divergence can become part of a broader systematic or structured analysis workflow.
The platform does not change the Double Divergence methodology. The same divergence classifications and confirmation principles apply across PatternSmart-supported platforms. What changes is the software environment in which the indicator is used.
Relevant Product Features
The indicator includes configurable features that allow traders to control how divergence observations are confirmed, filtered, displayed, and monitored.
Wait 1 Bar
Wait 1 Bar controls whether the indicator requires one completed confirmation bar before finalizing a detected Double Divergence signal. When enabled, the signal is confirmed after the next bar has completely closed. This can provide additional confirmation while potentially making the signal slightly later.
Enhanced Mode
Enhanced Mode provides additional structural validation for potential signals. Its purpose is to refine confirmation and help address signal quality and noise within the detection process.
Divergence Bar Range
Divergence Bar Range controls the structural search boundaries used when evaluating divergence. It relates to historical swing selection and the distance between the structures being compared.
Divergence Lookback and Filter Length
Divergence Lookback relates to historical evaluation and swing identification, while Filter Length relates to internal smoothing and structural consistency. Both are advanced parameters that can influence signal sensitivity and structural evaluation.
Show Char and Show Line
These visualization settings control how identified divergence information is presented on the chart. They affect presentation rather than changing the underlying methodology.
Only Show Last Signal Within Bars can also help manage historical signal display and improve visual clarity when many past signals are present.
Enable Alert
Enable Alert provides an alert function for confirmed signals. Alert settings are separate from signal generation and do not change how divergence is calculated.
A Practical Way to Read a CCI Divergence
When a CCI Double Divergence signal appears, beginners should avoid immediately asking, “Should I buy or sell?”
A better sequence is:
First, examine what price is doing.
Second, identify the type of divergence.
Third, consider what CCI is showing about price deviation.
Fourth, examine the broader market structure.
Finally, look for additional confirmation before making an independent trading decision.
This approach keeps the indicator in its proper role: a source of technical evidence rather than a replacement for market analysis.
Who Can Benefit from CCI Double Divergence?
CCI Double Divergence can be particularly relevant to traders interested in market extremes, cyclical price behavior, and mean-reversion analysis. It can also be useful for technical analysts who want another way to examine extended price movements.
It should not be viewed as a standalone decision-making system. The PatternSmart methodology emphasizes that price action remains important and that additional confirmation from market structure, support and resistance, or other analytical tools can strengthen interpretation.
[Get Started With CCI Double Divergence Pro for MultiCharts x.NET]
Looking for the complete mathematical breakdown, step-by-step optimization guides, and advanced trading strategies? Explore our comprehensive documentation:
Visit the Technical Inputs Manual: Double Divergence Pro for full parameter tuning.
Read the master guide on the Double Divergence Indicator Series.
Frequently Asked Questions
What does CCI measure?
CCI measures how far price has moved away from its statistical average. This makes it useful for studying price deviation and extended market conditions.
What is CCI Double Divergence?
CCI Double Divergence compares price movement with CCI behavior to identify situations where price and price deviation are no longer moving in complete agreement.
Does divergence predict a reversal?
No. Divergence is an analytical observation, not a guaranteed reversal prediction. Additional confirmation and market context remain important.
What is the difference between regular and hidden divergence?
Regular divergence can provide evidence that the current price movement is losing alignment with the indicator. Hidden divergence is more commonly associated with pullbacks and potential continuation of an existing trend.
Is CCI Double Divergence suitable for trending markets?
CCI Double Divergence can be useful in several market environments, but the indicator knowledge base identifies range-bound, cyclical, and extended-price conditions as particularly relevant. Powerful trends can reduce the effectiveness of mean-reversion-oriented analysis.
Why use CCI instead of another Double Divergence indicator?
Each Double Divergence indicator provides a different analytical perspective. CCI focuses on price deviation, market extremes, cyclical movement, and mean reversion. The methodology remains consistent, but the information supplied by the underlying indicator changes.
Conclusion
CCI Double Divergence provides a structured way to study the relationship between price movement and price deviation.
For beginners, the most important concept is simple: a divergence signal is not an instruction to trade. It is a reason to look more closely.
By combining CCI’s perspective on price deviation with the PatternSmart Double Divergence methodology, traders can examine market extremes, cyclical behavior, and potential changes in market conditions within a disciplined confirmation-based framework.
For MultiCharts .NET users, the indicator also fits naturally into a structured and extensible environment designed for quantitative analysis, C# development, and systematic workflows.
The objective is not to predict the market with certainty. It is to organize technical evidence more clearly so that market decisions can be based on a broader understanding of current conditions.