Understand Directional Movement and Changing Market Control
One of the most important questions in technical analysis is not simply whether price is rising or falling, but which side of the market is maintaining control.
A rising market may continue making higher highs, yet buying pressure can gradually weaken. Likewise, a declining market may continue making lower lows even as selling pressure begins to lose strength. These changes are not always obvious from price alone.
DMI Double Divergence for MultiCharts .NET provides a structured way to study these situations by combining the Directional Movement Index (DMI) with the PatternSmart Double Divergence methodology. The objective is to help traders examine whether directional pressure continues to support price movement or whether market control is beginning to change.
What Is DMI?
The Directional Movement Index, or DMI, evaluates directional movement by comparing two primary components:
- Positive Directional Indicator (+DI) — represents bullish directional pressure.
- Negative Directional Indicator (-DI) — represents bearish directional pressure.
Together, these components provide information about the relative directional influence of buyers and sellers.
This is an important distinction from indicators that focus mainly on momentum. DMI is concerned with directional dominance—whether bullish or bearish pressure is becoming more influential as a trend develops.
For example, when price is moving higher, traders may want to know whether buyers continue to demonstrate sufficient directional pressure to support that movement. When price is declining, the corresponding question is whether sellers remain in control.
DMI provides a framework for examining these relationships.
Why DMI Divergence Matters
Traditional divergence occurs when price and an indicator begin behaving differently.
Consider a declining market that continues to establish lower lows. If bearish directional control is simultaneously becoming weaker, the two observations are no longer fully aligned.
This does not mean that price must immediately reverse. Instead, the disagreement provides additional information about the current market condition.
The same principle applies to an advancing market. If price continues making higher highs while bullish directional dominance begins weakening, traders may have reason to examine the trend more carefully.
DMI Double Divergence focuses on these changes in directional control rather than treating divergence as a prediction of what price will do next.
How Double Divergence Adds Confirmation
The PatternSmart Double Divergence methodology is based on confirmation rather than prediction.
Instead of reacting to the first indication that directional pressure may be weakening, the methodology evaluates whether the deterioration develops through multiple stages of confirmation.
The general analytical process is:
- Observe price movement.
- Examine directional movement.
- Compare price behavior with DMI behavior.
- Evaluate whether divergence develops.
- Look for confirmation.
- Consider the broader market structure.
This approach helps place a divergence observation into context.
A Double Divergence signal should therefore be viewed as additional analytical evidence, not as a guaranteed reversal or continuation signal. Confirmation from price action, market structure, support and resistance, and other technical information remains important.
Understanding Bullish and Bearish DMI Divergence
DMI Double Divergence can provide two important perspectives.
Bullish DMI Double Divergence
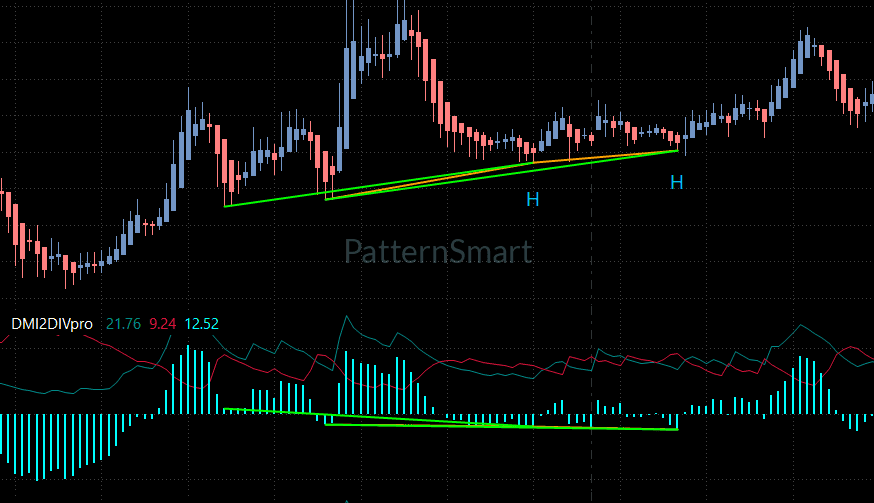
A bullish DMI Double Divergence may develop when price continues making lower lows while bearish directional control is progressively weakening.
The important observation is not simply that price is falling. It is that the directional pressure supporting the decline may be losing influence.
This can place greater attention on the possibility of changing market conditions, but it does not by itself establish that a bullish reversal will occur.
Bearish DMI Double Divergence
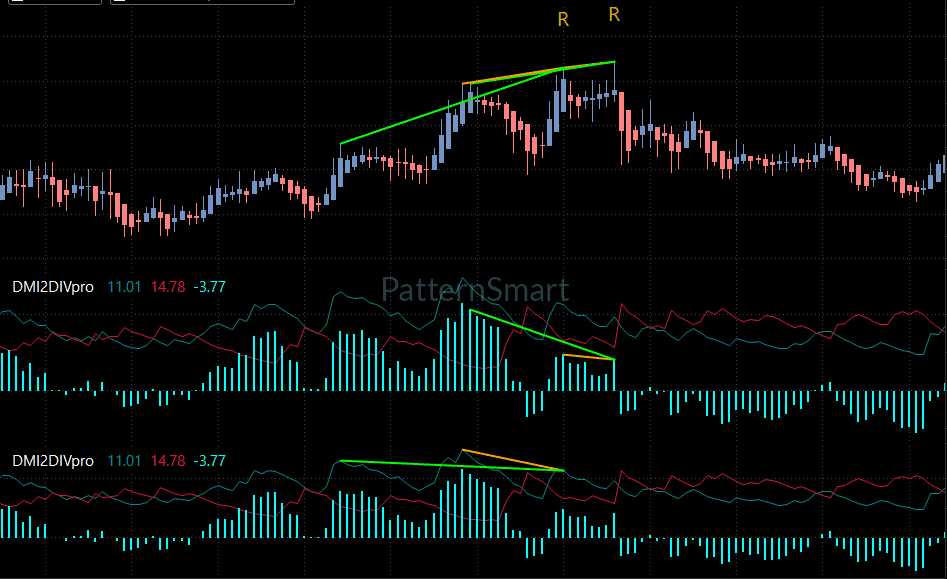
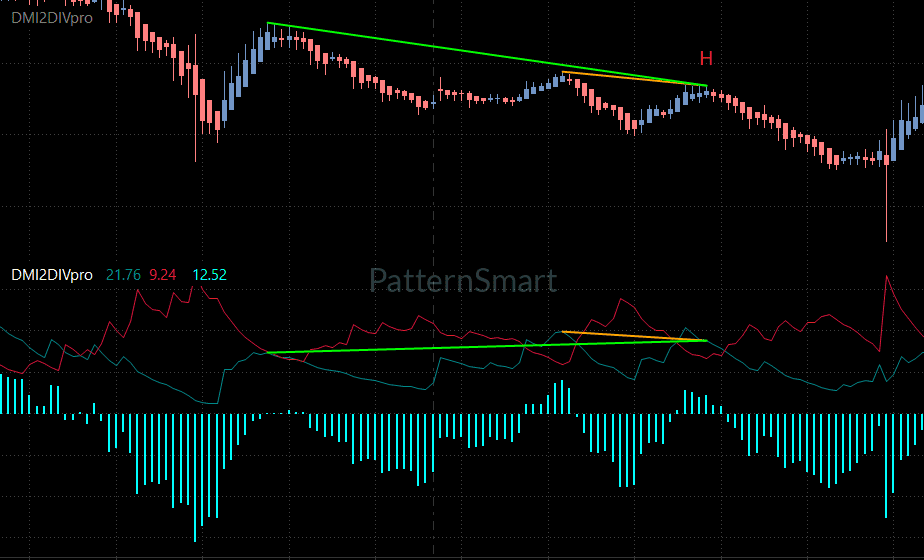
A bearish DMI Double Divergence may occur when price continues making higher highs while bullish directional control begins fading.
Again, the signal represents a developing disagreement between price and directional pressure.
Rather than automatically interpreting this as a short entry, traders can use the information to investigate whether the existing trend remains structurally supported.
DMI Double Divergence and Trend Confirmation
DMI is particularly useful for traders interested in trend confirmation and directional bias.
In an established trend, price can sometimes continue moving in the same direction even while the underlying directional pressure changes. Monitoring this relationship can provide another perspective on trend quality.
This makes DMI Double Divergence relevant to:
- Trend-following analysis
- Breakout evaluation
- Trend continuation
- Trend transition analysis
- Position trading
- Medium-term technical analysis
The indicator is generally most informative in established trending and directional markets. It may provide less information during prolonged sideways conditions or periods of limited directional commitment.
DMI vs. ADX: What Is the Difference?
DMI and ADX are related concepts, but they answer different analytical questions.
ADX focuses on overall trend strength without identifying which side of the market is dominant.
DMI focuses on directional movement and provides information about the relative influence of bullish and bearish pressure.
Therefore, traders studying DMI Double Divergence are primarily interested in directional control, rather than simply asking whether a trend is strong or weak.
This distinction makes DMI particularly useful when the question is:
“Is the current direction of the market still being supported by the dominant side?”
DMI Double Divergence for MultiCharts .NET
MultiCharts .NET is designed for traders and developers who work with systematic analysis, quantitative research, and customized trading environments. Its C# integration, object-oriented development environment, and extensibility make it suitable for users who want analytical tools within a professional software-development workflow.
DMI Double Divergence fits naturally into this environment by providing a consistent analytical framework for examining directional movement and divergence.
For MultiCharts .NET users, the indicator can become part of a broader structured workflow in which DMI-based observations are evaluated alongside price behavior, market structure, and other analytical information.
The platform implementation does not change the underlying Double Divergence methodology. The same analytical principles remain consistent across PatternSmart’s supported platforms.
Practical Features for Structured Analysis
DMI Double Divergence includes configurable options designed to help users control signal generation, filtering, alerts, and chart presentation.
Relevant features include:
- Wait 1 Bar — adds one bar of confirmation before a signal is finalized.
- Show Regular Bullish — displays regular bullish divergence.
- Show Regular Bearish — displays regular bearish divergence.
- Show Hidden Bullish — displays hidden bullish divergence.
- Show Hidden Bearish — displays hidden bearish divergence.
- Enhanced Mode — applies additional structural filtering.
- Divergence Lookback — controls swing-point detection.
- Filter Length — controls smoothing and structural filtering.
- Enable Alert — enables real-time alerts.
- Show Char and Show Line — control important chart visualizations.
These settings are configuration tools rather than separate trading strategies. Their purpose is to allow the indicator to fit different analytical workflows while preserving the underlying Double Divergence methodology.
A Simple Way to Use DMI Double Divergence
For traders new to the methodology, a straightforward analytical process can help.
First, identify the broader price trend. Then examine whether directional movement continues to agree with that trend.
If price continues advancing or declining while directional dominance begins weakening, pay closer attention to the developing structure.
When a Double Divergence signal appears, treat it as an observation that deserves further investigation—not as an automatic trading decision.
Finally, look for supporting evidence from price action, market structure, support and resistance, and your broader trading plan.
This keeps the focus on analysis before action.
Who Can Use DMI Double Divergence?
DMI Double Divergence may be useful for traders who want to study:
- Directional market movement
- Trend quality
- Bullish and bearish pressure
- Trend continuation
- Potential changes in market control
- Breakout and trend environments
It can be applied across markets such as futures, Forex, stocks, commodities, cryptocurrencies, and market indices. Typical analytical timeframes include 15-minute, 30-minute, 1-hour, 4-hour, daily, and weekly charts.
[Get Started With DMI Double Divergence Pro for MultiCharts x.NET]
Looking for the complete mathematical breakdown, step-by-step optimization guides, and advanced trading strategies? Explore our comprehensive documentation:
Visit the Technical Inputs Manual: Double Divergence Pro for full parameter tuning.
Read the master guide on the Double Divergence Indicator Series.
Frequently Asked Questions
Is DMI Double Divergence a trading system?
No. It is a decision-support and technical analysis tool. Divergence provides information about changing market conditions but does not guarantee a reversal, continuation, or profitable trade.
Does DMI measure momentum?
DMI primarily evaluates directional movement and the relative dominance of bullish and bearish pressure. It should not be treated simply as a momentum oscillator.
What is the main purpose of DMI Double Divergence?
Its primary purpose is to help traders evaluate whether directional pressure remains aligned with price movement or whether directional control is beginning to weaken.
Is DMI Double Divergence useful in sideways markets?
Its analytical value may be reduced during prolonged sideways markets because DMI is designed to emphasize directional structure. Price action and broader market context remain important.
Does the MultiCharts .NET version use a different Double Divergence methodology?
No. Platform implementation may differ, but the underlying PatternSmart Double Divergence methodology remains consistent across supported platforms.
Explore Directional Movement More Systematically
DMI Double Divergence for MultiCharts .NET provides a structured way to examine the relationship between price and directional market control.
Rather than attempting to predict the next market move, it encourages traders to ask a more useful analytical question: Is the current price direction still supported by the underlying directional pressure?
By combining DMI analysis with Double Divergence confirmation and broader market context, traders can develop a more disciplined approach to evaluating trend quality, directional bias, and potential changes in market control.
For MultiCharts .NET users interested in systematic, quantitative, and structured technical analysis, DMI Double Divergence offers another analytical perspective to incorporate into an existing trading workflow.