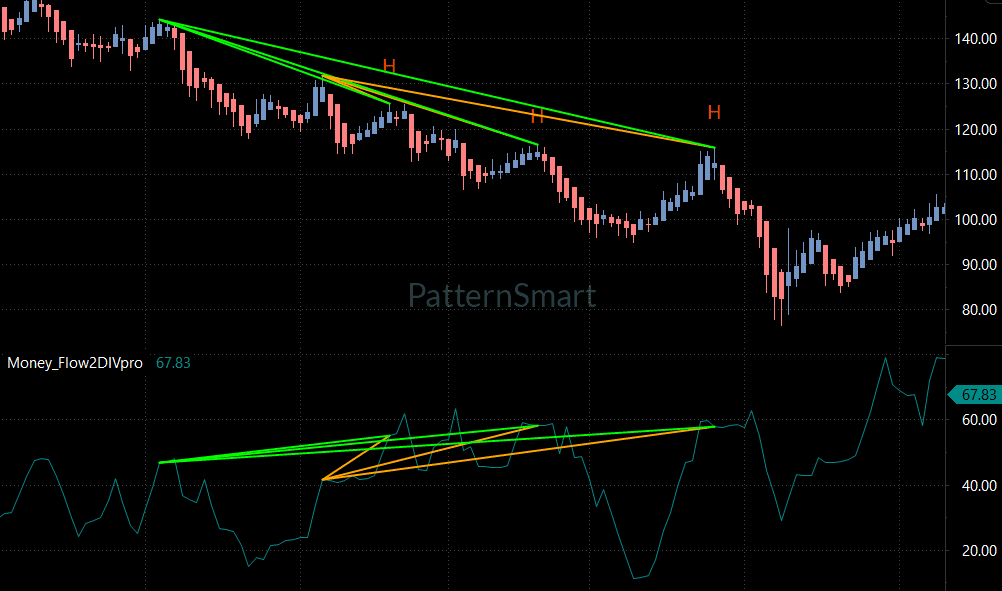
This educational article breaks down the structure of three sequential Double Divergence signals (labeled “H”) visible on the provided chart.
Divergence indicators provide technical traders with deep insights into underlying momentum shifts before they reflect in price extremes. When utilizing advanced tools such as MoneyFlow2DIVpro on MultiCharts .NET, Double Divergence setups occur when multiple swing highs establish simultaneous, overlapping regular divergence patterns.
1. Indicator & Chart Technical Setup
- Platform: MultiCharts .NET
- Indicator Sub-window:
Money_Flow2DIVpro(currently printing67.83) - Price Range: Overall movement spans from above
140.00down to a major low near75.00. - Divergence Structure:
- Green Trendlines: Connect macro swing peaks across wider time intervals.
- Orange Trendlines: Connect micro/intermediate swing peaks across tighter time intervals.
2. Analysis of the Three Sequential Double Divergence Signals
The chart highlights three distinct high points labeled “H”, each representing a unique Double Divergence signal where green and orange lines meet at an inflection point:
      Price Structure vs. Money Flow Divergence Summary
┌───────────────────┬─────────────────────┬───────────────────────────┐
│ Signal Point      │ Price Action        │ MoneyFlow Oscillator      │
├───────────────────┼─────────────────────┼───────────────────────────┤
│ 1st Signal "H"    │ Lower High (~130.00)│ Higher High Peak (~62.00) │
│ 2nd Signal "H"    │ Lower High (~118.00)│ Higher High Peak (~60.00) │
│ 3rd Signal "H"    │ Lower High (~115.00)│ Flat / Marginal High (~58)│
└───────────────────┴─────────────────────┴───────────────────────────┘
Signal 1: The First “H” Point (~130.00 Level)
- Price Behavior: Price forms a clear Lower High (LH) at
~130.00relative to the major peak above140.00. - MoneyFlow Behavior: The sub-window shows the indicator reaching a Higher High (HH) near
62.00compared to the indicator level at the140.00+price high. Both green and orange trendlines anchor to this peak. - Divergence Meaning: Institutional selling absorption took place. Despite money flow increasing during the retracement, price was firmly capped below
130.00.
Signal 2: The Second “H” Point (~118.00 Level)
- Price Behavior: Following a push lower to
~108.00, price attempts a second corrective rally, stalling at a Lower High near~118.00. - MoneyFlow Behavior: The indicator registers another Higher High relative to previous baseline troughs/peaks (green line extending from the original origin and orange line extending from the lower trough).
- Divergence Meaning: Compounded regular divergence. Over multiple swings, every rally in indicator momentum fails to produce higher price action, signaling persistent overhead supply.
Signal 3: The Third “H” Point (~115.00 Level)
- Price Behavior: Price drops to
~96.00before staging a final corrective rally up to~115.00. - MoneyFlow Behavior: The indicator rises back up to near
58.00–60.00, forming extended green and orange divergence lines connected all the way back to the early origin points. - Divergence Meaning: The multi-tiered Double Divergence reaches maximum confluence across three separate cycles. The inability of price to move higher despite three successive money flow expansions indicates complete seller dominance.
3. Market Context Analysis
- Overall Trend Regime: The chart displays a prolonged bearish downtrend, characterized by a series of lower highs (
>140.00$\rightarrow$130.00$\rightarrow$118.00$\rightarrow$115.00) and lower lows (108.00$\rightarrow$96.00$\rightarrow$~75.00). - Role of the “H” Signals: Each “H” point marks the exact high of a counter-trend corrective rally within the larger downtrend.
- Post-Signal Expansion:
- After Signal 1 (“H”), price fell from
130.00to108.00. - After Signal 2 (“H”), price dropped from
118.00to96.00. - After Signal 3 (“H”), the culmination of all accumulated divergence triggered the sharpest markdown phase, driving price aggressively down to the cycle low near
~75.00.
- After Signal 1 (“H”), price fell from
4. Confirmation & Trade Execution Rules
Divergence warns of weakness, but trade execution requires structural confirmation:
Confirmation Criteria Visible on Chart:
- Candlestick Rejections: At each “H” point, price displays prominent upper shadows (wicks) followed immediately by solid bearish engulfing candles.
- Indicator Rollover: Following each “H” peak, the
Money_Flow2DIVproline rolls over sharply to break down below its short-term moving average/slope line. - Break of Local Swing Support: A short entry is confirmed when price breaks the low of the rejection candle structure at each “H” high.
Execution Guidelines:
- Entry: Market short upon candle completion breaking local swing support following point “H”.
- Stop Loss: Set invalidation slightly above the specific “H” peak (
~131.50,~119.50, or~116.50respectively). - Profit Target: Measure risk-to-reward targeting previous swing support levels or trailing down to key demand zones (
100.00,90.00, and80.00).
[Get Started With MoneyFlow Double Divergence Pro for MultiCharts x.NET]
Looking for the complete mathematical breakdown, step-by-step optimization guides, and advanced trading strategies? Explore our comprehensive documentation:
Visit the Technical Inputs Manual: Double Divergence Pro for full parameter tuning.
Read the master guide on the Double Divergence Indicator Series.