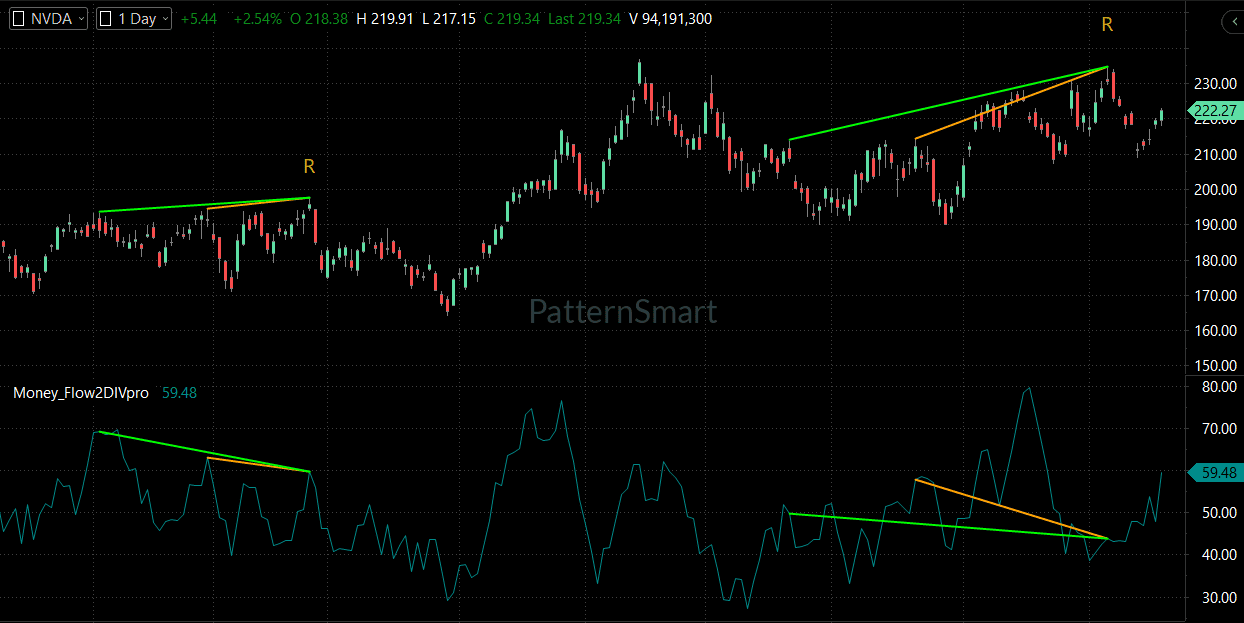
This educational guide analyzes two distinct Regular Bearish Double Divergence signals (labeled “R”) on the NVIDIA (NVDA) 1-day timeframe chart.
Divergence indicators provide traders with valuable forward-looking insight into potential trend exhaustion and market turning points. When plotting momentum and volume oscillators like MoneyFlow2DIVpro on standard charting platforms like MultiCharts x.NET, identifying Regular Bearish Double Divergence signals can help pinpoint high-probability short-side reversals and trade exits.
1. Chart Overview & Indicator Parameters
- Asset: NVIDIA Corp. (NVDA)
- Timeframe: Daily (
1 Day) - Platform: MultiCharts x.NET
- Indicator:
Money_Flow2DIVpro(Currently reading59.48) - Key Signals: Two distinct Regular Bearish Double Divergence points marked “R”
- Green Trendlines: Primary/macro trendlines connecting wider swing peaks.
- Orange Trendlines: Secondary/micro trendlines connecting shorter, intermediate swing peaks.
A Regular Bearish Double Divergence occurs when price creates higher highs across consecutive peaks, while the underlying money flow indicator simultaneously forms lower highs across matching points. The overlap of both macro (green) and micro (orange) divergence trendlines at a single price peak flags significant internal momentum weakness despite nominal price gains.
2. Detailed Breakdown of the Double Divergence Signals (“R”)
                 Summary of NVDA Double Divergence Signals
┌─────────────┬──────────────────────────┬───────────────────────────────┬────────────────────────────┐
│ Signal      │ Price Action Peak        │ MoneyFlow Oscillator Peak     │ Immediate Outcome          │
├─────────────┼──────────────────────────┼───────────────────────────────┼────────────────────────────┤
│ First "R"   │ Higher High (~198.00)    │ Double Lower High (~57.00)    │ Selloff to ~166.00         │
│ Second "R"  │ Higher High (~233.00)    │ Double Lower High (~42.00)    │ Selloff to ~200.00         │
└─────────────┴──────────────────────────┴───────────────────────────────┴────────────────────────────┘
Signal 1: The First “R” Signal (~198.00 Level)
- Price Action (Top Pane):
- Price pushes from an initial peak near
193.00to a Higher High (HH) near~198.00. - Both the green (macro) and orange (micro) trendlines slope upward to hit the peak labeled “R”.
- Price pushes from an initial peak near
- MoneyFlow Indicator (Bottom Pane):
- While price makes higher highs, the
Money_Flow2DIVproindicator prints two distinctly Lower Highs (LH). - The green line shows macro decay from an initial peak near
70.00down to~57.00at the point of “R”. - The orange line shows micro decay from an intermediate peak down to
~57.00.
- While price makes higher highs, the
- Divergence Mechanism: Buyers managed to push price slightly higher into the
198.00zone, but money flow was contracting significantly. This hidden weakness signaled that institutional support for the rally was waning.
Signal 2: The Second “R” Signal (~233.00 Level)
- Price Action (Top Pane):
- After a prolonged uptrend from
166.00, price forms a new high above225.00and then prints a Higher High near~233.00at the peak labeled “R”. - The green trendline connects the earlier structural high near
212.00to233.00. - The orange trendline connects a more recent intermediate peak near
225.00to233.00.
- After a prolonged uptrend from
- MoneyFlow Indicator (Bottom Pane):
- In dramatic contrast to the ascending price structure, the
Money_Flow2DIVprooscillator makes aggressive Lower Highs. - Following an overbought spike near
80.00, money flow collapses down to around42.00at the exact bar where price hits233.00. - Both the green and orange lines slope steeply downward.
- In dramatic contrast to the ascending price structure, the
- Divergence Mechanism: This multi-layered divergence signaled severe exhaustion. Despite NVDA reaching new all-time chart highs at
233.00, net capital volume into the stock was substantially lower than during previous swing points.
3. Market Context Analysis
- Macro Trend Background:
- The overall market structure across the visible chart is predominantly bullish, rising from
~170.00up to~233.00. - Within a strong uptrend, Regular Bearish Double Divergence signals act as major counter-trend reversal warnings or key exit points for long positions.
- The overall market structure across the visible chart is predominantly bullish, rising from
- Market Behavior Following Signal 1:
- Following the first “R” signal at
~198.00, price underwent a sharp, multi-bar correction. - NVDA dropped from
~198.00down to a cycle low of~166.00—a decline of over 16%—before finding support and resuming the broader uptrend.
- Following the first “R” signal at
- Market Behavior Following Signal 2:
- After the second “R” signal at
~233.00, NVDA experienced a quick, severe sell-off. - Price dropped from the peak at
233.00down to around200.00before staging a partial bounce to current levels around222.27.
- After the second “R” signal at
4. Signal Confirmation & Execution Rules
While divergence provides an early warning, entering trades solely on a divergence signal increases risk. Technical traders require price confirmation before initiating short positions:
Confirmation Criteria Visible on Chart:
- Rejection Candlesticks at “R”:
- At both “R” peaks, price forms prominent upper shadows/tails (rejection of higher prices), immediately followed by long red down-candles.
- Break of Local Swing Lows:
- Signal 1 Confirmation: Confirmed when price broke below the low of the rejection bar at
~190.00, accelerating the decline to166.00. - Signal 2 Confirmation: Confirmed when price broke below the intermediate swing support at
~225.00, dropping straight toward200.00.
- Signal 1 Confirmation: Confirmed when price broke below the low of the rejection bar at
- Indicator Breakdown:
- The
Money_Flow2DIVproline actively breaks down toward or below the50.00median line following the occurrence of “R”.
- The
Execution Framework:
- Short Entry: Triggered on the close of the confirmation candle breaking local structure support following the “R” signal.
- Stop Loss: Positioned slightly above the swing peak labeled “R” (
~200.00for Signal 1;~235.00for Signal 2). - Profit Targets: Key prior support levels (e.g.,
180.00/166.00for Signal 1;210.00/200.00for Signal 2).
[Get Started With MoneyFlow Double Divergence Pro for MultiCharts x.NET]
Looking for the complete mathematical breakdown, step-by-step optimization guides, and advanced trading strategies? Explore our comprehensive documentation:
Visit the Technical Inputs Manual: Double Divergence Pro for full parameter tuning.
Read the master guide on the Double Divergence Indicator Series.