This educational guide breaks down the concept of a Double Divergence using the analysis of the visual setup provided.
Divergence analysis remains one of the most reliable methods for technical traders to identify underlying market exhaustion and impending trend reversals. When executed on platforms like MultiCharts .NET, specialized indicators such as MoneyFlow2DIVpro provide clear visual representations of structural divergence.
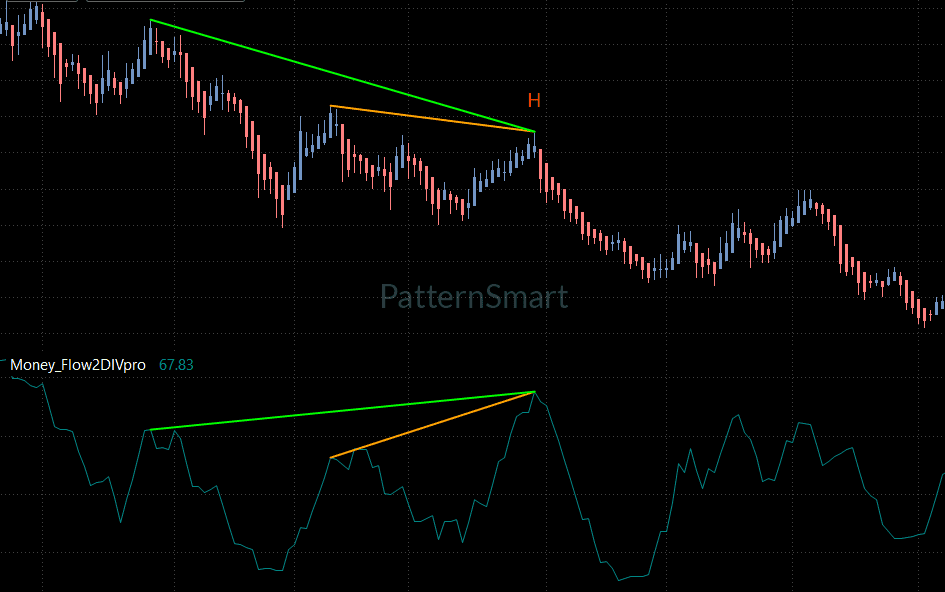
1. Overview of the Setup & Indicator
- Platform: MultiCharts .NET
- Indicator Sub-window:
Money_Flow2DIVpro(currently printing a reading around67.83) - Price Range: High near
~155.00, low near~82.00 - Signal Analyzed: Bearish Double Divergence (indicated by overlapping green and orange trendlines)
A Double Divergence occurs when price action and an oscillator diverge across multiple distinct swing points simultaneously. Rather than comparing just two adjacent peaks, a double divergence setup links three sequential high points on price and indicator sub-windows to confirm hidden market weakness.
2. Analysis of the Double Divergence Signal
The chart highlights a prominent bearish structure where two distinct divergent lines converge at a single critical high labeled “H” (near the 125.00 price level):
Signal Component A: The Primary (Macro) Bearish Regular Divergence (Green Lines)
- Price Behavior: The major high above
150.00connects downwards via a green line to the lower swing high at H (~125.00). Price is making a Lower High (LH). - MoneyFlow Behavior: Looking at the sub-window, the indicator peak corresponding to the
150.00+price high is significantly lower (around~60.00) compared to the indicator peak at point H (which reaches near~80.00). The indicator is making a steep Higher High (HH). - Interpretation: This represents standard hidden/regular momentum expansion against a broader downtrend—capital flows aggressively into the rally, but price fails to make a higher high, indicating institutional selling into strength.
Signal Component B: The Secondary (Micro) Bearish Regular Divergence (Orange Lines)
- Price Behavior: Connecting the intermediate swing peak (
~133.00) to the subsequent peak H (~125.00) via the orange trendline shows another clear Lower High in price. - MoneyFlow Behavior: Over the same timeframe, the indicator moves from a lower level to a higher peak at point H, forming a horizontal-to-ascending line (Higher High).
- Interpretation: On a localized basis, buying pressure increased during the pullback, yet price was restricted from expanding above
130.00.
The “Double” Confluence:
By combining both the macro (green) and micro (orange) divergence structures into the single high labeled “H”, the market signals extreme structural resistance. Even though money flow expanded heavily towards the 80.00 overbought mark on the sub-chart, price momentum failed at every step to make higher price peaks.
3. Market Context Analysis
Understanding the surrounding price structure helps contextualize why this signal produced a powerful expansion move downward:
- Prior Downtrend: Prior to high H, the chart displays a strong bearish regime, declining from above
150.00down to below110.00. - Counter-Trend Rally: The move leading up to point H was a multi-bar corrective rally from the
~105.00low back up toward125.00. - The Resulting Fall: Once the double divergence completed at high H, the market underwent a sharp sell-off, cascading straight through key support levels to reach a cycle low near
~82.00.
The double divergence precisely marked the termination point of the corrective rally inside a higher-timeframe downtrend.
4. Signal Confirmation & Trade Execution Rules
In professional trading, a divergence signal alone serves as an alert, not an immediate entry execution. Confirmation is essential before opening a short position:
Key Confirmation Elements Visible on the Chart:
- Rejection Candlestick Pattern at “H”: At peak H, price forms a sharp rejection tail (upper shadow) near
125.00, followed immediately by a long red bearish engulfing candle. - Indicator Hook/Rollover: The
Money_Flow2DIVprooscillator turns sharply downward from the overbought~80.00threshold. - Break of Local Swing Support: Confirmation is fully achieved when price breaks below the low of the candle that formed peak H, accelerating momentum down into the
100.00and90.00regions.
Execution Summary:
- Entry: Short entry triggers on the breakdown below the confirmation candle following point H.
- Stop Loss: Placed just above the swing high H (
~126.50). - Take Profit Targets: Scale out at key previous structure lows (
105.00, then trailing down toward the85.00area).
[Get Started With MoneyFlow Double Divergence Pro for MultiCharts x.NET]
Looking for the complete mathematical breakdown, step-by-step optimization guides, and advanced trading strategies? Explore our comprehensive documentation:
Visit the Technical Inputs Manual: Double Divergence Pro for full parameter tuning.
Read the master guide on the Double Divergence Indicator Series.