Analyze Directional Movement, Evaluate Potential Reversals, and Identify Possible Trend Continuation
Overview
Understanding whether a market trend is strengthening, weakening, or potentially changing direction is an important part of technical analysis. Price action provides essential information, but examining an indicator alongside price can offer another perspective on the market’s current condition.
DMI Double Divergence Pro for ProRealTime is designed to help traders analyze the relationship between price movement and the Directional Movement Index (DMI). By identifying Regular and Hidden Double Divergence patterns, it provides additional analytical evidence for evaluating potential reversals and possible trend continuation.
Rather than treating divergence as an automatic trading signal, the Double Divergence methodology encourages traders to examine the broader market structure, assess confirmation, and interpret each pattern in context.
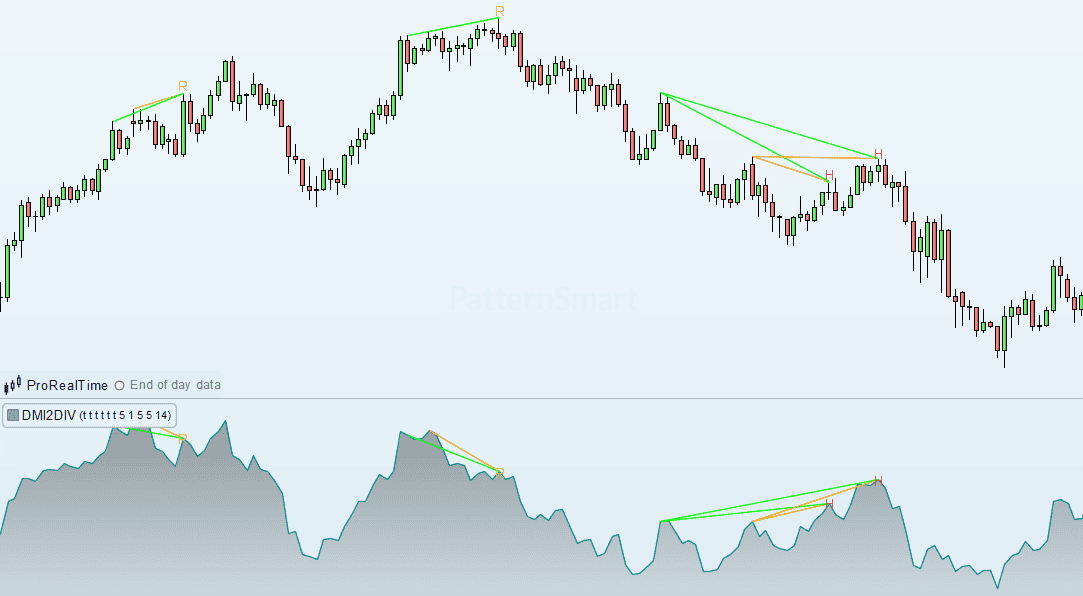
Developed for ProRealTime users, this indicator brings PatternSmart’s Double Divergence methodology to a platform widely used for chart-based market analysis. Because of a ProRealTime platform limitation, the visualization uses two separate indicators: one for the main price chart and another for the subchart. This arrangement allows the relevant lines and characters to be displayed in their respective chart areas.
What Is the Directional Movement Index (DMI)?
The Directional Movement Index, commonly known as DMI, is a technical analysis indicator used to examine directional price movement. It helps traders assess the relationship between upward and downward directional movement.
DMI analysis commonly involves three components:
- Positive Directional Indicator (+DI): Represents upward directional movement.
- Negative Directional Indicator (-DI): Represents downward directional movement.
- Average Directional Index (ADX): Measures trend strength rather than identifying whether the trend is bullish or bearish by itself.
The directional indicators can help traders evaluate which side of the market is showing greater directional movement, while ADX provides a separate perspective on the strength of a trend.
DMI is useful for studying directional conditions, but it should not be interpreted in isolation. A directional reading does not guarantee that a trend will continue, and a change in directional behavior does not automatically confirm a reversal.
This is where divergence analysis can provide additional context.
What Is Double Divergence?
Divergence occurs when price action and an indicator develop different swing structures. For example, price may establish a new high while the corresponding indicator fails to confirm that high in the expected way.
The Double Divergence methodology examines these relationships to help traders recognize situations that may deserve closer attention. It focuses on the interaction between price behavior and indicator behavior rather than relying on a single reading.
DMI Double Divergence Pro supports the analysis of four principal divergence types.
1. Regular Bullish Double Divergence
Regular Bullish Double Divergence is associated with a potential downside reversal.
It occurs when price forms lower lows while the DMI indicator’s corresponding swing structure does not confirm the same degree of downward progression. This disagreement may suggest that the current bearish movement deserves further examination.
However, the pattern alone does not establish that the market has bottomed. Traders can look for additional evidence, such as a change in price structure or other signs of buying strength, before considering a bullish interpretation.
2. Regular Bearish Double Divergence
Regular Bearish Double Divergence is associated with a potential upside reversal.
In this situation, price forms higher highs while the relevant DMI swing structure fails to confirm the same upward progression. The difference between price and indicator behavior may indicate that the advance warrants closer analysis.
A bearish divergence does not guarantee that price will decline. Strong trends can continue despite divergence, so traders should evaluate the signal alongside resistance levels, market structure, and subsequent price behavior.
3. Hidden Bullish Double Divergence
Hidden Bullish Double Divergence is associated with potential bullish trend continuation.
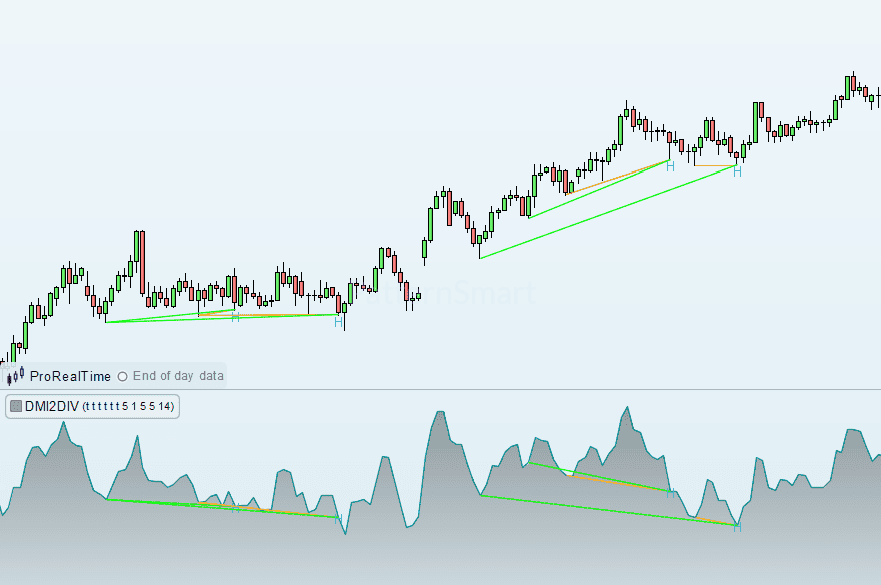
It is examined when price forms higher lows while the corresponding indicator structure develops in the opposite relationship required by the Hidden Bullish pattern. The pattern may provide evidence that a bullish trend remains relevant after a pullback.
Traders can use it to evaluate whether a retracement may be occurring within a broader upward structure. Confirmation from price action and the wider market context remains important.
4. Hidden Bearish Double Divergence
Hidden Bearish Double Divergence is associated with potential bearish trend continuation.
It is examined when price forms lower highs while the indicator’s corresponding swing structure develops in the opposite relationship required by the Hidden Bearish pattern. This may support further investigation of a pullback within a broader downtrend.
The pattern does not ensure that the decline will resume. Traders should assess whether price continues to respect the broader bearish structure and whether additional evidence supports the continuation scenario.
[Get Started With Double Divergence Pro for ProRealTime]
Looking for the complete mathematical breakdown, step-by-step optimization guides, and advanced trading strategies? Explore our comprehensive documentation:
Visit the Technical Inputs Manual: Double Divergence Pro for full parameter tuning.
Read the master guide on the Double Divergence Indicator Series.
Why Analyze Double Divergence with DMI?
DMI offers a directional-movement perspective that differs from indicators designed primarily to measure momentum or price extremes. By applying the Double Divergence methodology to DMI, traders can examine whether the indicator’s swing behavior agrees with the market’s price structure.
This can help organize several aspects of technical analysis:
- Directional movement: Examine the relationship between upward and downward directional movement.
- Potential reversals: Identify Regular Divergence patterns that may warrant closer attention when an established move appears to be losing confirmation.
- Potential continuation: Evaluate Hidden Divergence patterns in the context of an existing trend and its pullbacks.
- Price–indicator comparison: Study the relationship between market swings and corresponding indicator swings.
- Confirmation-based analysis: Use divergence as one piece of evidence rather than a standalone decision-making rule.
DMI Double Divergence Pro is intended to support analysis, not replace it. The value of a divergence pattern depends on the market environment, the quality of the surrounding price structure, and whether subsequent behavior provides confirmation.
DMI Double Divergence Pro for ProRealTime: Two-Indicator Visualization
ProRealTime has a platform limitation that affects how the indicator’s visual elements can be presented across the price chart and indicator subchart. To accommodate this limitation, the implementation uses two separate indicators.
Main-chart indicator
The first indicator is used on the main price chart. It displays the relevant divergence lines and characters in relation to price action, helping traders see where the identified patterns correspond to market swings.
Subchart indicator
The second indicator is used in the DMI subchart. It displays the corresponding lines and characters in the indicator area, making it easier to compare the DMI swing structure with the price structure shown on the main chart.
Why are two indicators required?
The two-indicator arrangement is a platform-specific visualization requirement. One indicator handles the main-chart presentation, while the other handles the subchart presentation. Together, they support the intended comparison between price and DMI behavior.
Important: The two indicators are components of the ProRealTime implementation of the same Double Divergence analysis. They should not be understood as two separate trading methodologies.
This arrangement helps keep the price-based and indicator-based visual information in their appropriate chart areas while making their relationship easier to inspect.
How to Use DMI Double Divergence in Market Analysis
A disciplined workflow can help traders interpret divergence patterns more consistently.
Step 1: Assess the broader market structure
Determine whether price is trending upward, trending downward, or moving sideways. Identify relevant swing highs, swing lows, support, and resistance before interpreting a divergence pattern.
Step 2: Examine the DMI structure
Observe the directional-movement information and its relationship to recent price swings. Consider whether the indicator confirms the latest movement or shows a meaningful difference in swing behavior.
Step 3: Identify the divergence category
Determine whether the pattern is Regular Bullish, Regular Bearish, Hidden Bullish, or Hidden Bearish. These categories have different analytical implications: Regular Divergence is commonly associated with potential reversal analysis, while Hidden Divergence is commonly associated with potential trend continuation.
Step 4: Look for confirmation
Do not assume that a divergence pattern must lead to a reversal or continuation. Examine subsequent price behavior and other relevant technical evidence to assess whether the initial interpretation is supported.
Step 5: Apply risk management
Even when several technical factors align, uncertainty remains. Consider invalidation levels, position sizing, and the potential consequences of an incorrect interpretation before making a trading decision.
Who Can Benefit from DMI Double Divergence Pro?
DMI Double Divergence Pro for ProRealTime may be useful for traders who:
- Use DMI as part of their technical analysis.
- Want to compare directional-movement behavior with price swings.
- Study potential reversal and trend-continuation scenarios.
- Prefer a structured approach to identifying divergence patterns.
- Use ProRealTime and want divergence visualization on both the price chart and the indicator subchart.
The indicator can be considered as part of a broader analytical process. Its patterns are most useful when interpreted alongside market structure, confirmation, and a clearly defined trading plan.
Frequently Asked Questions
What is DMI Double Divergence Pro for ProRealTime?
It is a PatternSmart technical analysis indicator designed to help ProRealTime users examine the relationship between price action and the Directional Movement Index through Regular and Hidden Double Divergence patterns.
Why are two separate indicators required in ProRealTime?
Due to a limitation of ProRealTime, two separate indicators are used to display the relevant lines and characters in different chart areas. One is used on the main price chart, and the other is used in the subchart.
What is the difference between Regular and Hidden Divergence?
Regular Divergence is commonly used to evaluate potential reversals, while Hidden Divergence is commonly used to evaluate potential continuation of an existing trend. Neither pattern guarantees the outcome.
Does DMI Double Divergence guarantee a market reversal?
No. Divergence identifies a relationship between price and indicator behavior that may deserve further analysis. Market context and subsequent confirmation remain essential.
Can DMI Double Divergence be used on its own?
It is better treated as one component of a broader technical analysis process. Traders should also consider price structure, market conditions, confirmation, and risk management.
Conclusion
DMI Double Divergence Pro for ProRealTime combines the directional-movement perspective of DMI with PatternSmart’s Double Divergence methodology. By highlighting relationships between price swings and indicator swings, it can help traders evaluate potential reversals and possible trend continuation in a more structured way.
The ProRealTime version uses two separate indicators because of platform limitations: one displays the relevant lines and characters on the main price chart, and the other displays them in the subchart. Together, these chart components support comparison of price and DMI behavior.
For traders who use DMI in their technical analysis, this approach offers an additional way to study market conditions. As with any technical indicator, divergence patterns should be interpreted probabilistically and combined with confirmation, market context, and disciplined risk management.
Explore DMI Double Divergence Pro for ProRealTime from PatternSmart to learn how Double Divergence analysis can complement your existing chart-reading process.