The Harami is a foundational two-candle reversal pattern that signals a sudden contraction in market volatility and a potential shift in momentum. Derived from the old Japanese word for “pregnant,” the pattern visually resembles its name: a large “mother” candlestick completely engulfs a much smaller “baby” candlestick.
In technical analysis, the Harami represents a decoupling of the dominant trend, warning traders that the prevailing buying or selling pressure has exhausted itself.
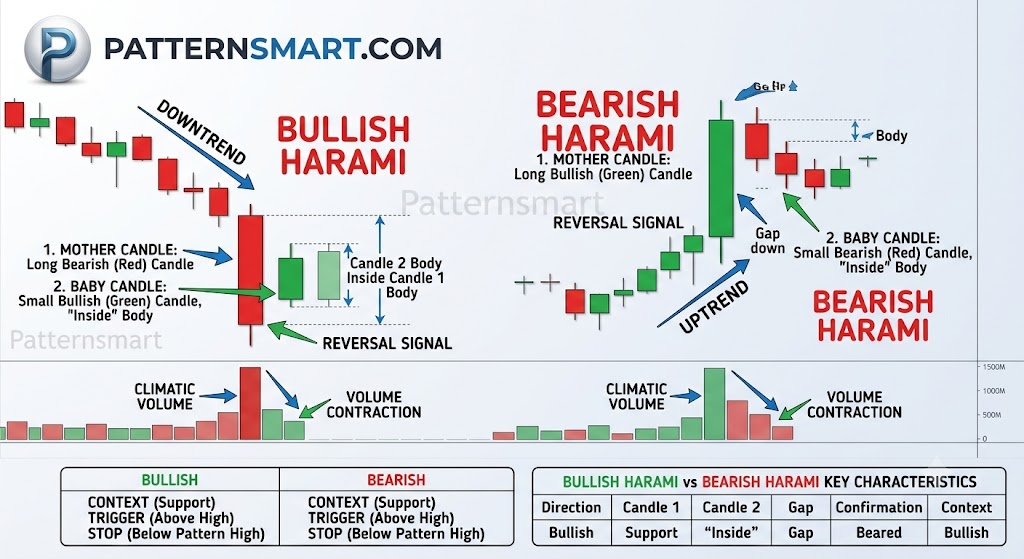
Anatomy of the Harami Pattern
The Harami relies strictly on the relationship between the real bodies of two consecutive sessions. While the wicks (shadows) can extend beyond the previous candle, the entire body of the second candle must fit inside the body of the first.
1. The Bullish Harami
- Prior Trend: A sustained downtrend.
- Candle 1 (Mother): A long, bearish (red/black) candle extending the downward momentum.
- Candle 2 (Baby): A small, bullish (green/white) candle. It opens with a gap up relative to the previous day’s close, and its entire real body stays contained within Candle 1’s real body.
- Market Psychology: Sellers are firmly in control during Candle 1. However, instead of continuing lower during the next session, price gaps higher or stabilizes immediately. Shorts begin covering, and buyers step in, trapping the remaining bears at the lows.
2. The Bearish Harami
- Prior Trend: A sustained uptrend.
- Candle 1 (Mother): A large, bullish candlestick validating the strong upward momentum.
- Candle 2 (Baby): A small, bearish candlestick. It opens with a gap down relative to Candle 1’s close, closing lower but keeping its body strictly inside the first candle’s body.
- Market Psychology: Euphoria rules Candle 1. The next day, aggressive buying fails to materialize, resulting in a gap down or an immediate pause. The bulls lack the conviction to drive prices to new highs, signaling that distribution is taking over.
The Harami Cross Variation: If the second candle is a Doji (where the open and close are virtually identical), the pattern becomes a Harami Cross. This indicates extreme indecision and carries a significantly stronger reversal probability than a standard Harami.
Technical Validation and Execution
Trading a Harami pattern in isolation is a low-probability strategy. Because it inherently represents a volatility squeeze, you need confirmation to validate a reversal before executing a position.
Volume Profile
A valid Harami setup typically exhibits specific volume dynamics:
- Candle 1 should print on high or above-average volume, showing a climatic push by the dominant trend.
- Candle 2 should print on drastically lower volume, highlighting the sudden halt in momentum and lack of follow-through.
Trade Setup and Rules
| Parameter | Bullish Harami Strategy | Bearish Harami Strategy |
| Context | Price hits key horizontal support or oversold RSI levels. | Price hits key horizontal resistance or overbought RSI levels. |
| Trigger | Price breaks above the high of the first candle (Mother). | Price breaks below the low of the first candle (Mother). |
| Stop Loss | Positioned just below the low of the entire pattern (Candle 1 low). | Positioned just above the high of the entire pattern (Candle 1 high). |
| Target | Nearest major resistance level or a fixed 1:2 risk-to-reward ratio. | Nearest major support level or a fixed 1:2 risk-to-reward ratio. |
Common Institutional Pitfalls
Traders frequently misinterpret the Harami by ignoring market structure. Keep these crucial realities in mind:
- Intraday vs. Daily Charts: On daily forex or cryptocurrency charts, standard “gaps” are rare because the market trades 24 hours a day. In these liquid environments, a second candle that opens exactly where the first closed but stays exceptionally small is still considered a structural Harami, provided the body contraction is massive.
- Continuation Risk: In a strong, institutional-driven trend, a Harami often functions as a simple pause or “inside bar” rather than a reversal. Always wait for the third candle to break the Mother candle’s range before committing capital.
Please check our Bearish and Bullish Patterns Indicator collection.