The Harami Cross is a highly potent, two-candle reversal pattern that signals a sudden halt in market momentum. In Japanese, harami translates to “pregnant,” which perfectly describes the pattern’s visual look: a large “mother” candle completely nesting a tiny “baby” Doji inside its real body range.
While a standard Harami utilizes a small body for its second candle, the Harami Cross features a Doji. This substitution makes it a much more reliable indicator of trend exhaustion, as a Doji represents complete structural equilibrium.
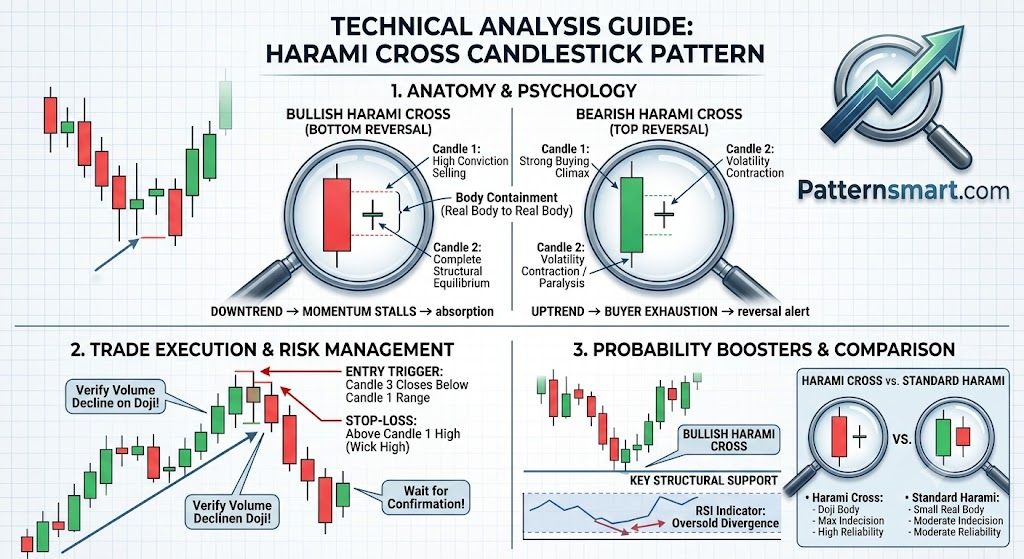
Anatomy of the Harami Cross
The pattern is classified as either Bullish or Bearish depending on the preceding trend.
To identify a valid Harami Cross, the following structural rules must be met:
The Bullish Harami Cross (Bottom Reversal)
- Prior Trend: The market must be in a defined downtrend.
- Candle 1 (The Mother): A long bearish (red) candle prints, confirming that sellers still have full control.
- Candle 2 (The Cross): A Doji forms on the subsequent period. Crucially, the horizontal line of the Doji (the open and close price) must be completely engulfed by the real body of Candle 1.
The Bearish Harami Cross (Top Reversal)
- Prior Trend: The market must be in a defined uptrend.
- Candle 1 (The Mother): A long bullish (green) candle prints, extending the upward surge.
- Candle 2 (The Cross): A Doji forms on the next period, with its open and close entirely nested within Candle 1’s green body.
The Market Psychology: Sudden Suffocation of Trend
The transition from a wide-bodied candle to a Doji illustrates a sharp contraction in volatility and a shift from high conviction to complete paralysis:
- The Setup (Candle 1): One side dominates the price action completely. In a downtrend, bears are aggressively shorting, driving prices down into what looks like a safe trend extension.
- The Break in Momentum (Candle 2): The next session opens with a price gap away from the prior close (gapping up in a downtrend, or down in an uptrend). Throughout the session, the dominant side tries to reclaim control but fails completely.
- The Standstill: By the close, the price finishes exactly where it opened. The fact that this entire battle took place inside the previous day’s range indicates that the dominant force has run out of gas. The trend has hit a wall of institutional absorption.
How to Trade the Harami Cross
The Harami Cross is fundamentally a warning sign. Because it concludes with a Doji (an absolute tie), you must use strict risk management rules and wait for secondary confirmation before taking a position.
1. The Entry Confirmation Rule
Never enter a trade immediately after the Doji closes. Instead, wait for Candle 3 to confirm the new direction:
- For a Bullish Setup: Enter long only if Candle 3 opens and closes as a strong green candle breakout above the high of Candle 1’s real body.
- For a Bearish Setup: Enter a short position only if Candle 3 closes below the low of Candle 1’s real body.
2. Strategic Stop-Loss Placement
The boundaries of the pattern offer highly technical, tight invalidation points:
- Long Positions: Place your stop-loss just below the lowest wick of Candle 1 (or the lowest point of the Doji, whichever is deeper).
- Short Positions: Place your stop-loss just above the highest wick of Candle 1 (or the apex of the Doji).
3. Boosting Probability via Confluence
- Volume Check: Look for high volume on Candle 1 (marking the final push), low volume on Candle 2 (the Doji, proving a lack of trend follow-through), and a surging volume profile on Candle 3 (the confirmation breakout).
- Oversold/Overbought Signals: If a Bullish Harami Cross prints while the Stochastic Oscillator or RSI is deeply oversold (< 20-30), or if it lands squarely on a major horizontal support floor, its historical success rate increases significantly.
Harami Cross vs. Standard Harami
| Characteristic | Standard Harami | Harami Cross |
| Candle 2 Body | Small real body (green or red) | Doji (No real body / flat line) |
| Indecision Level | Moderate | Maximum Equilibrium |
| Reversal Reliability | Moderate | High |
| Frequency on Charts | Common | Relatively Rare |
Because a Doji represents a more complete state of equilibrium than a small green or red candle, the Harami Cross is mathematically tougher to form and carries much stronger structural significance when looking to time macro trend changes.
Please check our Bearish and Bullish Patterns Indicator collection.