Introduction
The Broadening Formation is one of the most recognizable classical chart patterns in technical analysis. Most educational resources describe it primarily as a breakout pattern, where traders wait for price to break beyond one of the expanding trendlines before entering a trade.
While this approach is widely accepted, it only reveals part of the pattern’s value.
The examples below, detected automatically by the PatternSmart Broadening Formation Chart Pattern Indicator, demonstrate that a completed Broadening Formation can continue providing valuable market information long after the breakout has occurred.
Rather than treating the pattern as “finished” once price leaves the formation, traders can extend its boundary lines into future price action. These extension lines frequently evolve into highly respected dynamic support and resistance levels, accurately identifying future reversal zones, pullback areas, and profit-taking locations.
The following two real-market examples illustrate why Broadening Formation should be viewed not only as a breakout pattern, but also as a powerful market structure tool.
The Traditional View of Broadening Formation
A Broadening Formation consists of two diverging trendlines connecting progressively higher highs and lower lows.
Unlike contracting patterns such as triangles or wedges, volatility expands as the pattern develops, reflecting increasing disagreement between buyers and sellers.
Traditionally, traders use the pattern to anticipate:
- Bullish breakouts above the upper boundary
- Bearish breakouts below the lower boundary
- Increased volatility following the breakout
This breakout-based interpretation has been taught for decades and remains an effective trading approach.
However, it also causes many traders to overlook one of the pattern’s most useful characteristics.
A Different Perspective: The Pattern Doesn’t End After the Breakout
The completion of a Broadening Formation should not necessarily mark the end of its usefulness.
Instead, the two boundary lines often continue acting as future structural reference levels.
By extending these lines forward, traders frequently observe that price continues respecting them as if they were invisible support and resistance zones.
This behavior is remarkably consistent because the pattern boundaries represent areas where the market previously experienced intense battles between buyers and sellers. Those price relationships often remain important even after market conditions have changed.
Rather than asking,
“Where will the breakout occur?”
a more useful question may be,
“How will price react when it revisits these projected structural levels?”
The following examples demonstrate this concept.
Chart Example 1 – The Lower Boundary Continues Acting as Dynamic Support

In the first chart, the indicator automatically detects a Broadening Formation and projects both boundary lines into future price action.
Although the original pattern has already completed, the extended lower boundary continues influencing price for hundreds of bars afterward.
Point A – The First Structural Bounce
After a prolonged decline, price reaches the projected lower extension line almost precisely.
Instead of continuing lower, selling pressure quickly fades and buyers step into the market.
A meaningful upward reaction begins directly from the projected support line.
This illustrates that the lower boundary remains technically significant even though the original Broadening Formation is already complete.
Point B – Support Holds Again
Much later, after another aggressive selloff, price once again approaches the same projected lower boundary.
Despite the substantial time elapsed since the original pattern formed, the market reacts almost exactly at the extension line.
The result is another strong reversal.
This second successful test demonstrates that the extension line is not acting as a random trendline—it continues functioning as a genuine structural support level.
What This Example Teaches
Most traders would have ignored the Broadening Formation once price exited the pattern.
However, extending the lower boundary revealed two high-quality support reactions occurring long after the breakout.
Rather than serving only as a breakout pattern, the Broadening Formation became an objective framework for identifying future buying opportunities.
Chart Example 2 – Both Extension Lines Continue Defining Market Structure
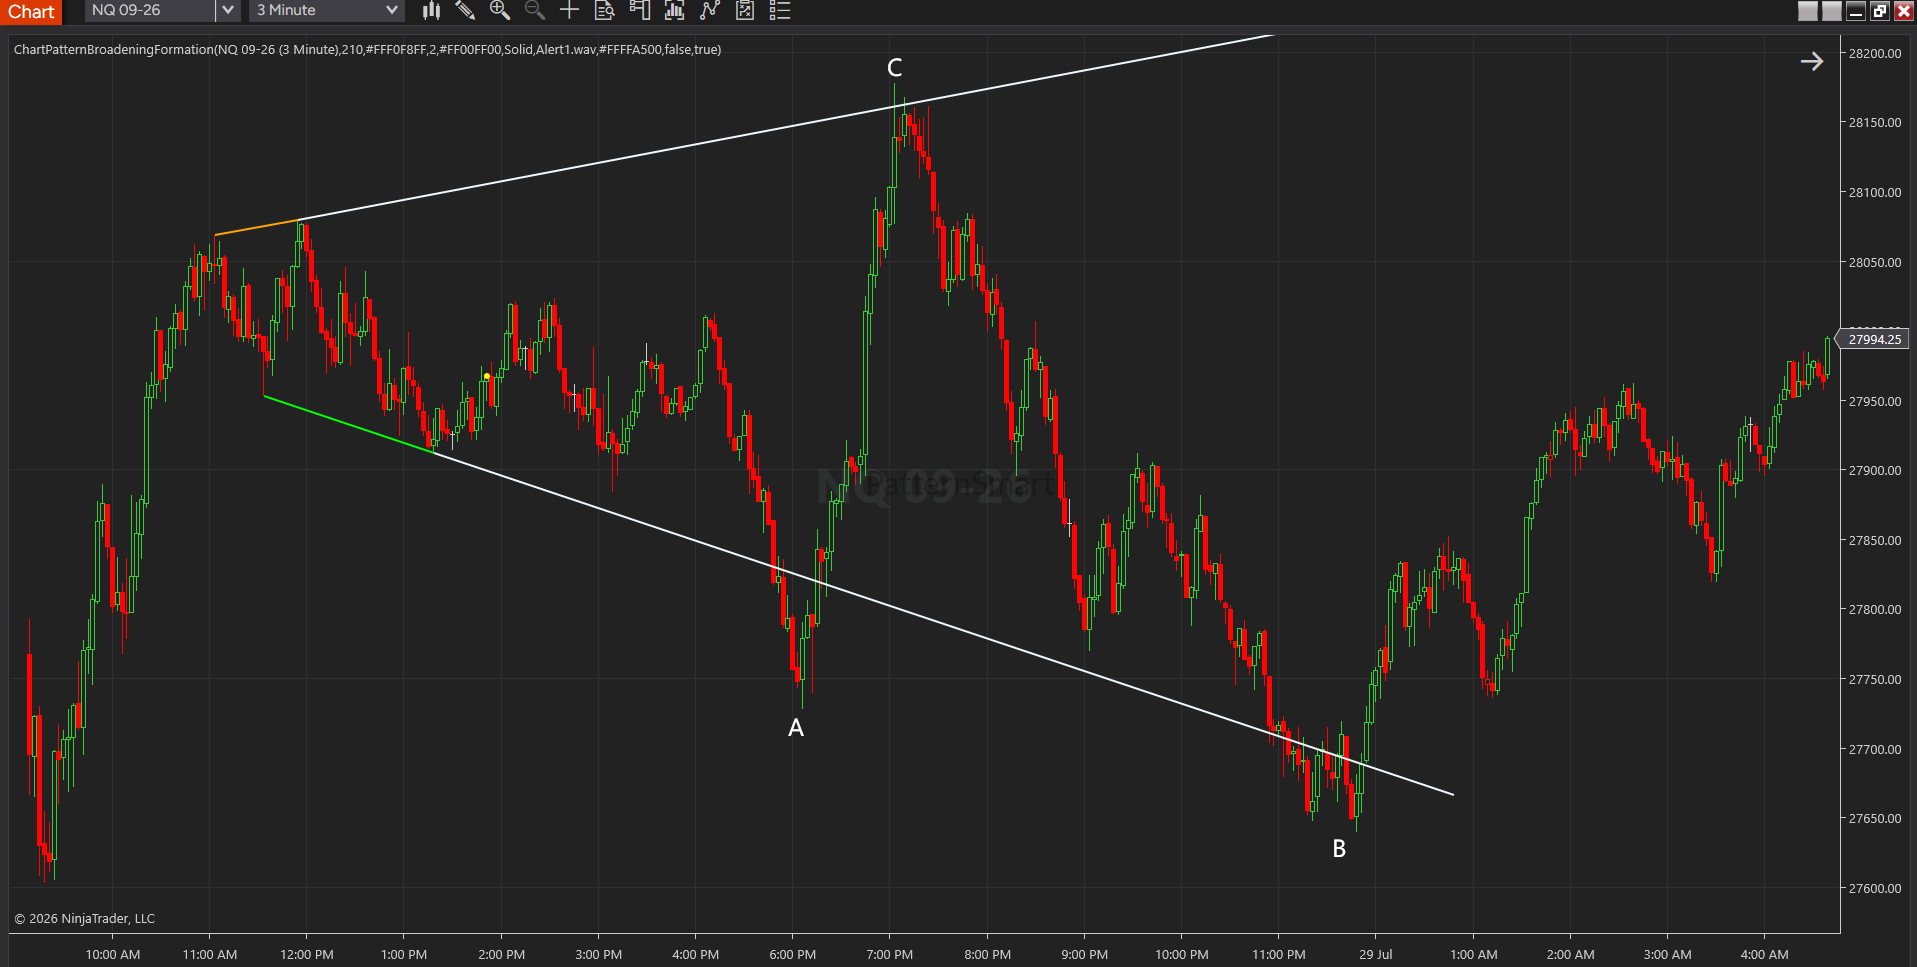
The second chart provides an even stronger demonstration.
After the Broadening Formation is detected, both boundary lines are extended forward.
Instead of producing only a breakout signal, the projected lines accurately identify three major turning points.
Point A – Lower Boundary Support
Price declines toward the projected lower extension.
As soon as price reaches the line, selling momentum weakens.
Buyers enter aggressively, producing a significant reversal.
Again, the lower boundary behaves as dynamic support rather than merely a historical pattern boundary.
Point B – Support Confirmed Again
Later in the session, price falls back toward the same lower extension.
The market respects the projected support for a second time.
Instead of accelerating lower, buyers once again defend the level, producing another sharp bounce.
Repeated reactions at the same projected boundary significantly increase confidence that the level represents genuine market structure rather than coincidence.
Point C – Upper Boundary Becomes Dynamic Resistance
Perhaps the most impressive example occurs after the strong rally from Point A.
Price accelerates sharply upward until it reaches the projected upper Broadening Formation extension.
The rally loses momentum almost exactly at the upper boundary.
A substantial reversal follows immediately afterward.
Notice that this resistance was identified hours earlier—before the rally even began.
The extension line effectively projected a future resistance level based entirely on the geometry of the original Broadening Formation.
Why Do These Extension Lines Continue Working?
Many traders naturally ask why a completed pattern should continue influencing future price.
Several market mechanisms help explain this phenomenon.
1. Institutional Order Memory
Large market participants often accumulate or distribute positions around important structural price levels.
Those areas frequently continue attracting institutional activity when revisited later.
2. Market Structure Remains Relevant
A Broadening Formation records the locations where buyers and sellers repeatedly challenged one another.
These structural relationships often remain important even after the original pattern has ended.
The market may no longer “remember” the pattern visually, but it often remembers the prices.
3. Psychological Reference Levels
Experienced traders naturally monitor previous technical structures.
When price approaches a projected boundary, many participants anticipate another reaction.
This collective behavior reinforces the support or resistance.
4. Supply and Demand Rebalancing
Each boundary represents an area where supply and demand previously shifted significantly.
When price revisits those levels, new buying or selling interest frequently emerges, producing another reaction.
Practical Trading Applications
Viewing Broadening Formation solely as a breakout pattern limits its potential.
Using the projected extension lines opens several additional trading opportunities.
Dynamic Support and Resistance
Instead of drawing arbitrary trendlines, traders can use objectively detected pattern boundaries as future structural levels.
Pullback Entries
In an existing trend, retracements toward an extension line often provide attractive locations to evaluate continuation trades.
Profit Targets
Projected boundaries frequently identify logical profit-taking zones.
Rather than relying on fixed risk-reward ratios alone, traders can align exits with important structural levels.
Reversal Analysis
When price reaches an extension line and simultaneously produces:
- Reversal candlestick patterns
- Momentum divergence
- Volume exhaustion
- Failure swings
the probability of a meaningful reversal often increases.
Trade Management
Extension lines can also serve as reference points for:
- Scaling into positions
- Scaling out of trades
- Adjusting trailing stops
- Evaluating trend strength
Why Automatic Pattern Detection Matters
One challenge with Broadening Formation analysis is consistency.
Two traders often draw different boundary lines on the same chart, leading to different conclusions.
The PatternSmart Broadening Formation Chart Pattern Indicator eliminates much of this subjectivity by automatically:
- Detecting valid Broadening Formations
- Drawing consistent upper and lower boundaries
- Extending both lines into future price action
- Providing objective structural reference levels
- Allowing traders to focus on interpreting market behavior instead of manually searching for patterns
Because every pattern is identified using the same detection rules, traders can analyze future support and resistance with greater confidence and consistency.
Broadening Formation as a Market Structure Tool
Perhaps the most important lesson from these examples is that a Broadening Formation should not be viewed as a pattern that loses its value after the breakout.
Instead, it should be regarded as a framework that continues to describe market structure well into the future.
The breakout itself is only one event in the pattern’s lifecycle.
The projected boundary lines often provide equally valuable information by identifying where future buying and selling pressure is likely to emerge.
In many cases, these extension lines become more useful than the breakout signal itself because they continue influencing price long after the original pattern has disappeared from view.
Conclusion
The two examples presented here demonstrate a broader way of interpreting Broadening Formations.
In the first chart, the projected lower boundary accurately identified two significant support reversals (A and B) well after the pattern had completed.
In the second chart, the same methodology identified two support reactions (A and B) from the lower extension, while the projected upper boundary precisely anticipated a major resistance reversal (C) during a subsequent rally.
These examples show that the true value of a Broadening Formation extends far beyond its traditional breakout interpretation. By projecting the pattern boundaries into future price action, traders gain objective, forward-looking support and resistance levels that can assist with trade entries, exits, pullback analysis, profit targets, and overall market structure assessment.
Rather than viewing a Broadening Formation as a pattern that ends at the breakout, traders should consider it a continuing analytical framework—one whose extension lines often reveal where the market is most likely to pause, reverse, or resume its trend. This perspective transforms the Broadening Formation from a simple breakout setup into a versatile tool for understanding the evolving structure of the market.
The Broadening Formation Chart pattern indicator is available in these platforms: Ctrader, MetaTrader(MT4, MT5), NinjaTrader 8, MultiCharts, MultiCharts x.NET, Tradingview, Prorealtime, SierraChart.
The Broadening Formation patterns presented in the following charts were automatically identified by the PatternSmart Broadening Formation Chart Pattern Indicator using the input settings shown below. Once detected, the indicator automatically extends the pattern boundaries into future price action, allowing traders to analyze potential support and resistance beyond the completion of the pattern.
