The attached charts of NYMEX Light Crude Oil Futures (CL) present two complementary perspectives of the same market. The higher-timeframe 100-range chart highlights the broader directional structure, while the 5-min Renko chart focuses on shorter-term price behavior and execution opportunities.
The dominant market structure remains bearish throughout most of the observed period. Price consistently forms lower highs and lower lows, confirming persistent selling pressure. However, the decline does not progress in a perfectly uniform manner. Several countertrend rallies emerge, creating opportunities to evaluate whether these advances represent genuine reversals or merely temporary corrections within the prevailing downtrend.
This is precisely the type of environment where DMI Double Divergence analysis can provide valuable confirmation by comparing directional movement with evolving price structure rather than relying solely on price action.
Understanding the DMI Double Divergence Indicator
Unlike oscillators that primarily measure momentum, the Directional Movement Index (DMI) evaluates the balance between bullish and bearish directional pressure. As trends mature, directional movement often begins changing before those changes become fully visible in price.
The DMI Double Divergence indicator applies the PatternSmart Double Divergence methodology to directional movement, helping traders evaluate situations where price and directional strength no longer move in agreement. Rather than predicting future price movement, the methodology provides additional confirmation that may strengthen an existing technical assessment when interpreted alongside price action and market context.
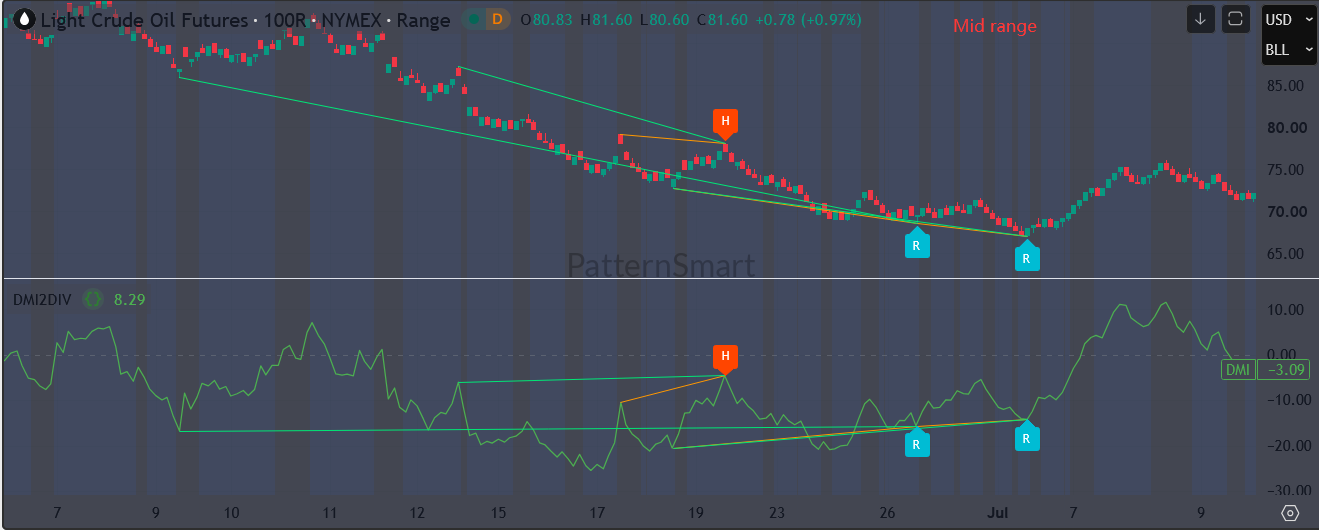
Higher Timeframe Analysis: Bearish Hidden Divergence
The 100-range chart identifies a Bearish Hidden Divergence, marked by the orange “H” labels.
Several important characteristics stand out:
- Price forms a lower high, maintaining the established sequence of declining swing highs.
- Meanwhile, the DMI indicator records a higher high, indicating that directional movement temporarily strengthens despite the inability of price to break the previous swing high.
- This disagreement between price structure and directional movement creates the Hidden Divergence.
From a methodological perspective, Hidden Divergence is generally associated with trend continuation rather than trend reversal. In this case, the signal develops after an extended decline rather than at a major market bottom.
The subsequent price action supports this interpretation. Following the divergence, buyers fail to generate sustained upside momentum, and selling pressure resumes, producing another leg lower toward the late-June lows.
This illustrates an important principle of the Double Divergence methodology: divergence should be interpreted within the prevailing trend rather than in isolation. A Hidden Divergence occurring inside a mature downtrend often deserves attention as potential confirmation that the broader bearish structure remains intact rather than evidence of an imminent reversal.
Regular Bullish Divergence Near the Lows
Later in the same chart, two blue “R” labels identify Bullish Regular Divergence.
Here, the relationship changes:
- Price establishes another lower low.
- The DMI indicator forms progressively higher lows.
Although price continues declining, directional movement no longer confirms the same degree of bearish participation. This weakening internal confirmation suggests that selling pressure is becoming less convincing.
The market subsequently stabilizes and begins a recovery toward the mid-$70 area.
It is important to emphasize that the divergence itself does not guarantee a trend reversal. Instead, it provides additional analytical evidence that the existing bearish trend may be losing directional conviction. Traders would typically seek confirmation from price structure, support levels, or other technical evidence before concluding that market conditions have materially changed.
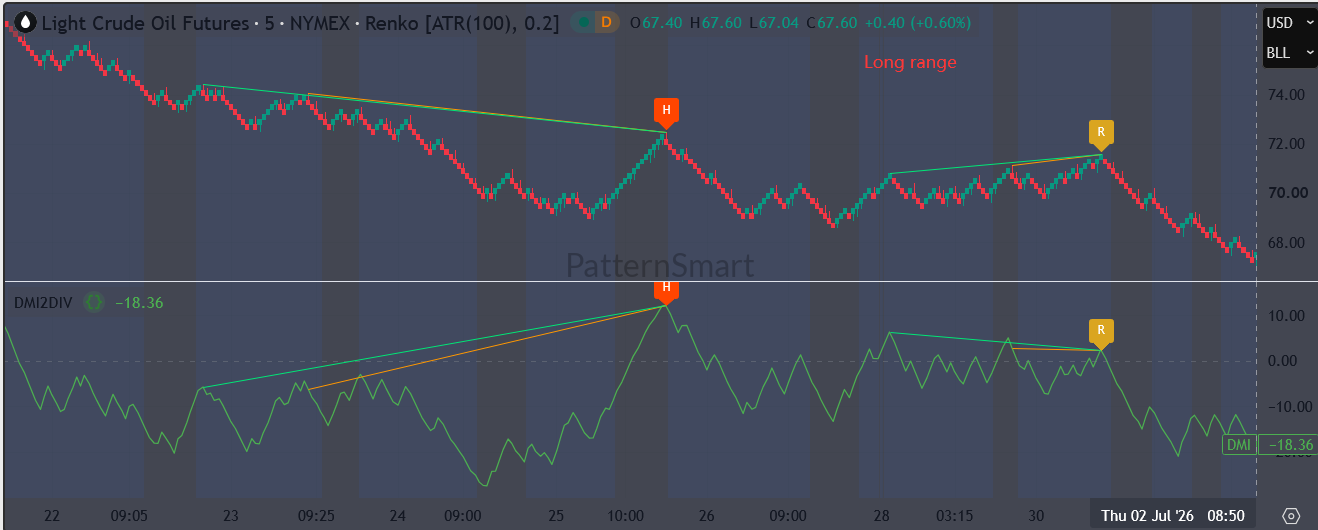
Lower Timeframe Analysis: Trend Continuation Confirmation
The Renko chart provides additional insight into shorter-term market behavior.
Two divergence events appear during the observed period.
Bearish Hidden Divergence
Near June 25, another Bearish Hidden Divergence develops.
Price produces a lower high while the DMI indicator records a higher high. The broader downtrend remains intact, suggesting that the temporary rally lacks sufficient strength to reverse the dominant bearish structure.
The market responds by resuming its decline almost immediately after the signal, reinforcing the continuation characteristics commonly associated with Hidden Divergence.
Bearish Regular Divergence
Later, near July 2, the indicator identifies a Bearish Regular Divergence.
At this stage:
- Price records a higher high.
- DMI produces a lower high.
Unlike Hidden Divergence, Regular Divergence suggests that directional movement is no longer fully supporting the latest price advance.
Following the signal, buyers lose control, and price rotates lower over the following sessions.
This sequence demonstrates how Regular Divergence may provide additional evidence that bullish momentum is weakening after an extended recovery, particularly when it develops near an area of previous resistance.
Market Context
Viewed together, the two charts present a consistent analytical narrative.
The higher timeframe establishes a dominant bearish market environment. Hidden Divergence appears during corrective rallies, reinforcing the continuation of that broader trend. As the decline matures, Bullish Regular Divergence begins to emerge, suggesting that downside directional movement is gradually weakening.
Meanwhile, the lower timeframe captures shorter-term fluctuations within that broader structure. Both Hidden and Regular Divergence identify periods where directional movement and price temporarily disagree, providing additional context for evaluating whether pullbacks or rallies are likely to continue or lose strength.
Rather than treating each divergence as an isolated trading signal, the sequence demonstrates the importance of combining divergence analysis with prevailing market structure and trend context. This confirmation-first approach reflects the core philosophy of the Double Divergence methodology.
TradingView Integration
TradingView provides an effective environment for DMI Double Divergence analysis by combining interactive charting with flexible visualization tools. Displaying divergence markers directly on both price and indicator panels allows traders to compare swing structure with directional movement more efficiently across multiple timeframes without changing their analytical workflow.
Relevant Product Features
Several capabilities shown in these charts support practical market analysis:
- Automatic Regular and Hidden Divergence detection reduces the need to manually compare swing highs and lows between price and the DMI indicator.
- Visual divergence trendlines clearly illustrate the relationship between price structure and directional movement, making confirmation easier to interpret.
- Labeled divergence markers distinguish Regular (“R”) and Hidden (“H”) signals directly on the chart, helping traders identify the type of divergence at a glance.
- Multi-timeframe compatibility enables the same analytical methodology to be applied consistently to higher-timeframe trend analysis and lower-timeframe execution, while maintaining identical interpretation principles across TradingView.
Educational Conclusions
The Crude Oil charts demonstrate that directional movement can reveal important changes in market behavior before those changes become fully reflected in price alone.
Throughout the observed period, Bearish Hidden Divergence repeatedly supported continuation of the prevailing downtrend during corrective rallies, while Bullish and Bearish Regular Divergence highlighted areas where directional participation began weakening. Rather than functioning as standalone trading signals, these observations contributed additional confirmation that strengthened the overall technical assessment.
The DMI Double Divergence methodology encourages traders to interpret divergence as part of a structured analytical process that includes price action, trend structure, and broader market context. By emphasizing confirmation over prediction, it helps traders evaluate evolving market conditions with greater discipline and a clearer understanding of how directional movement interacts with price.
Read the master guide on the Double Divergence Indicator Series.
Visit the Technical Inputs Manual: Double Divergence Pro for full parameter tuning.
The DMI Double Divergence Pro indicator is available in these platforms: Ctrader, MetaTrader(MT4, MT5), NinjaTrader 8, MultiCharts, MultiCharts x.NET, Tradingview(subchart only), Prorealtime(subchart only), SierraChart.