Identify High-Quality Divergence Signals with Advanced Double Divergence Analysis
Markets rarely reverse without leaving clues. While traditional divergence indicators compare a single price swing against a single oscillator swing, experienced traders often seek stronger evidence before making trading decisions. Stochastics Double Divergence Pro applies a more rigorous analytical methodology by validating the current price swing against two previous swing points, helping traders identify higher-quality Regular and Hidden divergence opportunities while reducing many weaker signals commonly produced by conventional divergence indicators.
Designed for TradingView, this indicator combines the proven Stochastic Oscillator with an advanced Double Divergence methodology to help traders analyze potential trend reversals, continuation opportunities, and momentum exhaustion across stocks, futures, forex, cryptocurrencies, and other financial markets.
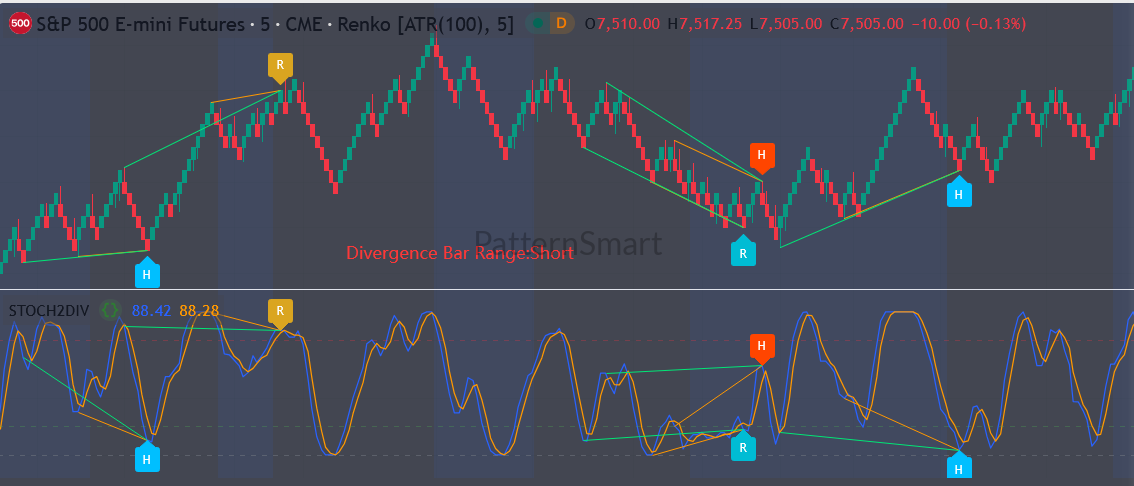
What Is the Stochastics Double Divergence Pro Indicator?
Stochastics Double Divergence Pro is a technical analysis indicator that detects bullish and bearish divergence using the Stochastic Oscillator. Unlike traditional divergence indicators that compare only one previous swing, this indicator validates the current market structure against two independent historical swing points.
This additional validation creates what is referred to as Double Divergence, providing traders with a more structured approach to identifying momentum shifts.
The indicator supports divergence analysis using either:
- Stochastic %K
- Stochastic %D
This flexibility allows traders to choose the oscillator line that best fits their trading style. The %K line offers greater responsiveness, while the smoother %D line may help reduce market noise.
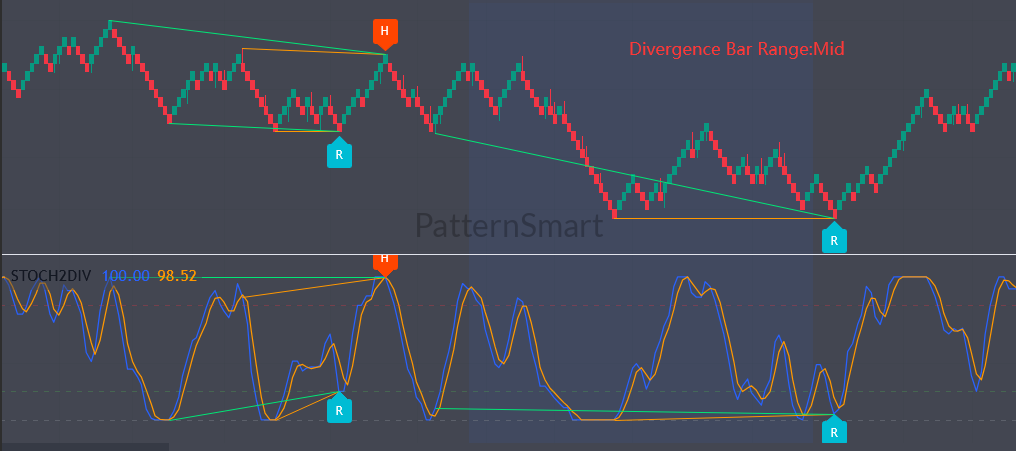
Understanding the Double Divergence Methodology
Standard divergence occurs when price and momentum move in opposite directions.
For example:
- Price creates a lower low while momentum creates a higher low.
- Price creates a higher high while momentum creates a lower high.
Although these situations may suggest weakening momentum, single divergences frequently fail during strong trends.
Double Divergence introduces an additional validation step.
Instead of comparing only one previous swing, the indicator evaluates two historical swing points. This extra confirmation helps verify that momentum has weakened consistently rather than producing a single isolated divergence.
The result is a more disciplined divergence methodology that focuses on stronger market structure.
Regular and Hidden Divergences
The indicator detects all four primary divergence types.
Regular Bullish Divergence
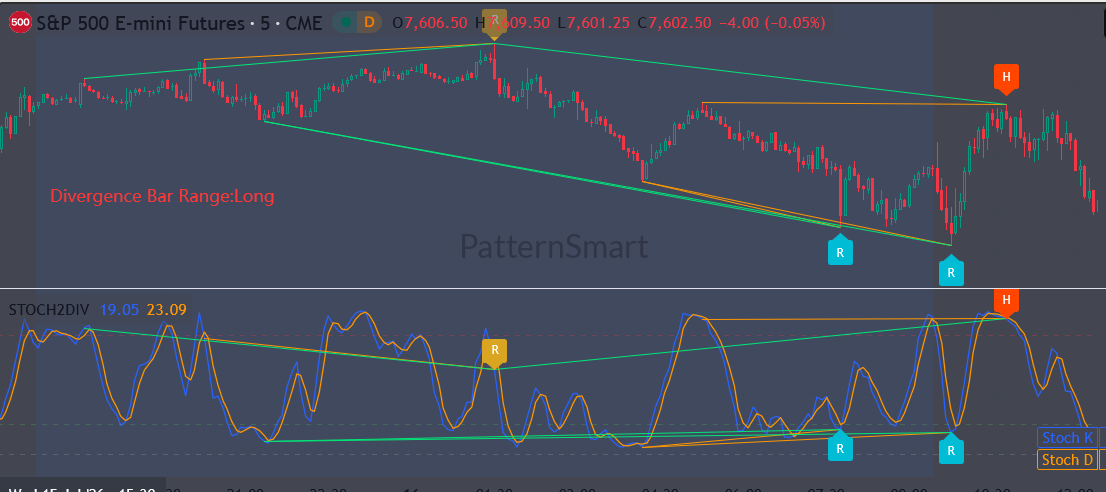
Regular Bullish Divergence occurs when price forms lower lows while the Stochastic oscillator forms higher lows.
This may indicate selling pressure is weakening and buyers are beginning to regain control.
Hidden Bullish Divergence
Hidden Bullish Divergence occurs when price forms higher lows while momentum forms lower lows.
This often suggests trend continuation during an existing uptrend.
Regular Bearish Divergence
Regular Bearish Divergence develops when price records higher highs while momentum creates lower highs.
This may indicate bullish momentum is fading despite continued price advances.
Hidden Bearish Divergence
Hidden Bearish Divergence appears when price forms lower highs while momentum records higher highs.
This pattern often supports continuation of an existing downtrend.
Why Use the Stochastic Oscillator?
The Stochastic Oscillator measures where current price closes relative to its recent trading range.
Rather than measuring trend strength directly, it evaluates market momentum and highlights periods where buying or selling pressure begins to weaken.
Because momentum frequently changes before price, the Stochastic Oscillator has long been used for divergence analysis.
With the ability to analyze either the %K or %D line, traders can choose between faster signals or smoother confirmation depending on market conditions.
Built Specifically for TradingView
TradingView has become one of the world’s most popular charting platforms thanks to its intuitive interface, cloud-based accessibility, and extensive market coverage.
Stochastics Double Divergence Pro integrates seamlessly with TradingView charts, allowing traders to monitor multiple asset classes from virtually any device without additional software.
Whether analyzing intraday charts or higher timeframes, the indicator provides consistent divergence visualization while taking advantage of TradingView’s alert system and charting capabilities.
Key Features
Advanced Double Divergence Detection
Validates divergence against two historical swing points rather than relying on a single comparison.
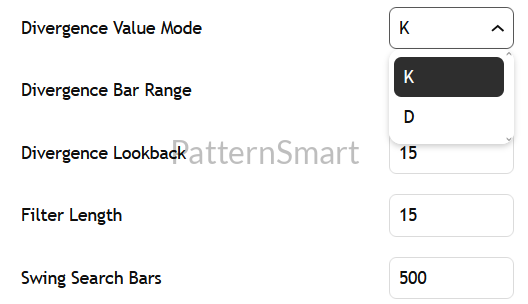
Selectable Divergence Source
Choose whether divergence calculations use the Stochastic %K line or the smoother %D line.
Four Divergence Types
Detects:
- Regular Bullish
- Hidden Bullish
- Regular Bearish
- Hidden Bearish
Adjustable Swing Analysis
Customize divergence sensitivity using configurable swing ranges and lookback settings to accommodate different trading styles.
Enhanced Validation Mode
Additional filtering helps eliminate weaker divergence structures and improves signal quality by enforcing stricter price relationships.
Optional One-Bar Confirmation
Wait for candle confirmation before generating signals to reduce premature entries.
Clean Chart Visualization
Display divergence lines, labels, and synchronized price-panel markers for easy visual analysis.
Signal Management
Optionally limit repeated signals occurring within a user-defined number of bars to maintain cleaner charts.
Fully Customizable Appearance
Adjust colors, labels, divergence lines, and display preferences to match your chart layout.
Built-In TradingView Alerts
Create automated alerts for:
- Regular Bullish Divergence
- Hidden Bullish Divergence
- Regular Bearish Divergence
- Hidden Bearish Divergence
Practical Benefits
Stochastics Double Divergence Pro helps traders:
- Detect potential momentum reversals earlier.
- Identify possible trend continuation opportunities.
- Reduce false divergence signals through Double Divergence validation.
- Customize sensitivity for different markets and timeframes.
- Monitor bullish and bearish momentum simultaneously.
- Improve chart clarity through organized signal visualization.
- Integrate divergence analysis into existing trading strategies without replacing other technical tools.
Who Is This Indicator For?
This indicator is suitable for:
- Swing traders
- Position traders
- Day traders
- Forex traders
- Futures traders
- Stock traders
- Cryptocurrency traders
It can be applied to virtually any liquid market where price action and momentum analysis are relevant.
Frequently Asked Questions
What makes Double Divergence different from regular divergence?
Traditional divergence compares one previous swing against the current swing. Double Divergence validates the current swing against two historical swing points, providing stronger structural confirmation.
Can I choose between %K and %D?
Yes. The indicator allows divergence detection using either the faster %K line or the smoother %D line.
Does the indicator detect Hidden Divergence?
Yes. Both Regular and Hidden Bullish and Bearish Double Divergences are included.
Can I customize the sensitivity?
Yes. Swing ranges, lookback periods, filtering options, confirmation settings, and visual components are fully configurable.
Does it support TradingView alerts?
Yes. Native TradingView alert conditions are included for all four divergence types.
Which markets can it be used on?
The indicator works on stocks, futures, forex, cryptocurrencies, ETFs, commodities, and most other instruments available on TradingView.
Improve Your Divergence Analysis
Stochastics Double Divergence Pro expands traditional divergence analysis by introducing a structured Double Divergence methodology that validates momentum against multiple historical swing points. Combined with configurable Stochastic analysis, flexible settings, and clear visual presentation, it provides traders with a disciplined framework for identifying potential reversals and trend continuation opportunities across a wide range of financial markets.
Whether you prefer the responsiveness of the %K line or the smoother confirmation of the %D line, Stochastics Double Divergence Pro delivers a comprehensive divergence analysis tool designed to support more informed trading decisions.
Read the master guide on the Double Divergence Indicator Series.
Visit the Technical Inputs Manual: Double Divergence Pro for full parameter tuning.
The Stochastics Double Divergence Pro indicator is available in these platforms: Ctrader, MetaTrader(MT4, MT5), NinjaTrader 8, MultiCharts, MultiCharts x.NET, Tradingview, Prorealtime(subchart only), SierraChart.