Market Overview
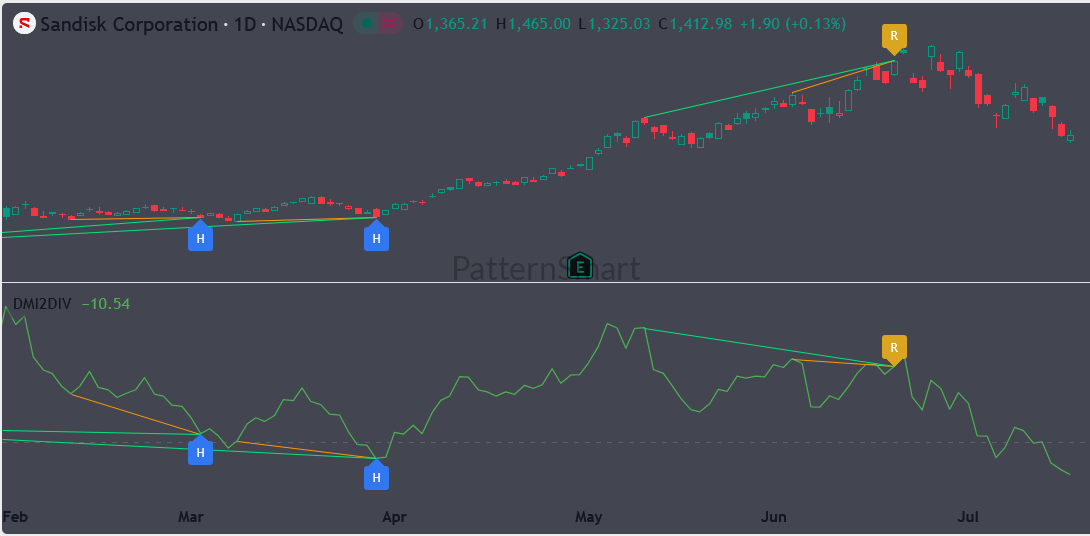
The daily chart of Sandisk Corporation (SNDK) demonstrates a market that transitioned from a prolonged accumulation phase into a powerful bullish trend before eventually losing momentum. Price advanced steadily from February through late June, producing a sequence of higher highs and higher lows that reflected strong buyer participation.
While the broader trend remained constructive for several months, the accompanying DMI Double Divergence indicator revealed important changes in underlying directional strength well before price itself began to reverse. This illustrates one of the primary advantages of divergence analysis: momentum often changes before price visibly follows.
Understanding the DMI Double Divergence Indicator
The DMI Double Divergence indicator is designed to identify situations where directional momentum and price begin moving out of synchronization.
Unlike traditional divergence tools that rely on a single comparison between two swing points, the Double Divergence methodology evaluates multiple sequential swing structures. This additional confirmation helps reduce many of the false signals commonly associated with standard divergence techniques.
On TradingView, the indicator automatically:
- Detects significant swing highs and lows
- Compares price structure with DMI momentum
- Draws divergence trendlines
- Places bullish (H) and bearish (R) markers directly on the chart
- Synchronizes signals between price and the indicator window for easier interpretation
This automation allows traders to focus on interpreting market structure instead of manually searching for divergence patterns.
Early Bullish Double Divergence
The first major signal appears during the February-March consolidation.
Price Action
Price forms two successive lower lows before establishing support.
Although the decline appears weak from a price perspective, sellers are still pushing the market to fresh lows.
DMI Behavior
The DMI indicator behaves differently.
Instead of confirming increasing downside momentum, the oscillator produces progressively higher lows.
This creates a bullish Double Divergence.
On the chart:
- Price trendlines slope downward.
- DMI trendlines slope upward.
- Blue H markers identify the completed bullish signal.
This disagreement between price and momentum suggests that selling pressure is steadily weakening.
Why the Signal Matters
Bullish divergence does not predict an immediate rally.
Instead, it indicates that bearish momentum is fading.
That distinction is important.
Strong trends rarely reverse because price suddenly changes direction.
More commonly:
- Selling pressure weakens.
- Buyers gradually regain control.
- Trend reversal develops afterward.
The SNDK chart follows this sequence almost perfectly.
After the bullish Double Divergence completed, price entered a sustained advance lasting several months.
The signal therefore identified a shift in market participation rather than merely highlighting an oversold condition.
Transition Into a Strong Uptrend
Following the bullish divergence:
- Higher lows begin forming.
- Higher highs develop consistently.
- Price accelerates throughout April and May.
- Trend strength remains healthy.
During this phase, the DMI indicator also trends upward, confirming improving directional strength.
Momentum and price remain aligned, providing little reason to anticipate a major reversal.
This represents the confirmation phase of the earlier divergence signal.
Bearish Double Divergence Near the High
As price approaches its late-June peak, the relationship between price and momentum begins changing.
Price
Price continues producing higher highs.
To many traders, the trend still appears healthy.
DMI
The DMI oscillator tells a different story.
Instead of confirming the new highs, momentum begins producing lower highs.
The indicator draws a descending trendline while price continues climbing.
This creates a bearish Double Divergence.
The yellow R marker identifies the completed bearish pattern.
Interpreting the Bearish Signal
This divergence suggests that buying pressure is no longer expanding despite higher prices.
The market continues moving upward, but momentum participation becomes increasingly limited.
This is often characteristic of:
- Trend exhaustion
- Institutional profit taking
- Reduced buying enthusiasm
- Increasing probability of correction
Importantly, the bearish divergence appears before the visible decline begins.
After the signal completes, SNDK enters a meaningful pullback that confirms the warning generated by the indicator.
Market Context
Neither divergence occurs in isolation.
Both signals appear within logical market environments.
Bullish Context
The bullish divergence develops:
- After a prolonged decline
- Near established support
- During weakening downside momentum
This combination improves the probability that buyers are beginning to regain control.
Bearish Context
The bearish divergence forms:
- After a lengthy bullish advance
- Near newly established highs
- Following several months of sustained buying
Late-stage trends frequently experience momentum deterioration before price reverses.
The bearish Double Divergence captures exactly this transition.
Reading the Complete Market Cycle
One of the strengths of this chart is that it demonstrates both sides of the Double Divergence methodology within a single trend cycle.
The sequence unfolds naturally:
- Downtrend loses momentum.
- Bullish Double Divergence develops.
- Price enters a sustained uptrend.
- Momentum gradually weakens.
- Bearish Double Divergence appears.
- Price begins correcting.
Rather than treating divergence as isolated events, the indicator helps traders visualize the evolution of momentum throughout an entire market cycle.
Practical Advantages on TradingView
The TradingView implementation simplifies divergence analysis by automatically detecting qualifying swing structures and drawing synchronized trendlines on both the price chart and the DMI panel. Signal markers clearly identify completed bullish and bearish Double Divergence patterns, allowing traders to review historical signals quickly and monitor developing setups without manually measuring swings.
Because all divergence components are displayed together, traders can evaluate momentum changes alongside price structure, making it easier to integrate divergence analysis with support and resistance, trendlines, moving averages, or broader trend analysis.
Educational Takeaways
The SNDK chart demonstrates that momentum often changes before price visibly reverses. The bullish Double Divergence identified weakening selling pressure during the accumulation phase, preceding a sustained multi-month advance. Later, the bearish Double Divergence revealed deteriorating buying momentum while price was still making new highs, providing an early warning of the subsequent correction.
Like any technical tool, the DMI Double Divergence indicator should not be used in isolation. The highest-probability signals typically occur when divergence aligns with broader market structure, trend context, and key support or resistance levels. By combining automated divergence detection with disciplined price action analysis, traders can gain earlier insight into potential trend transitions while maintaining a structured and objective approach to market analysis.
Read the master guide on the Double Divergence Indicator Series.
Visit the Technical Inputs Manual: Double Divergence Pro for full parameter tuning.
The DMI Double Divergence Pro indicator is available in these platforms: Ctrader, MetaTrader(MT4, MT5), NinjaTrader 8, MultiCharts, MultiCharts x.NET, Tradingview(subchart only), Prorealtime(subchart only), SierraChart.