In systematic technical analysis, pinpointing the precise transition from an aggressive markdown phase to a period of accumulation is critical for optimizing entry efficiency. While multi-bar formations provide lagging confirmation, the Inverted Hammer is a single-bar candlestick pattern that offers an early, real-time warning that supply is drying up and buyers are beginning to test overhead liquidity.
When integrated into a strict rule-based framework at major structural key levels, the Inverted Hammer provides tactical traders with a defined risk-to-reward setup.
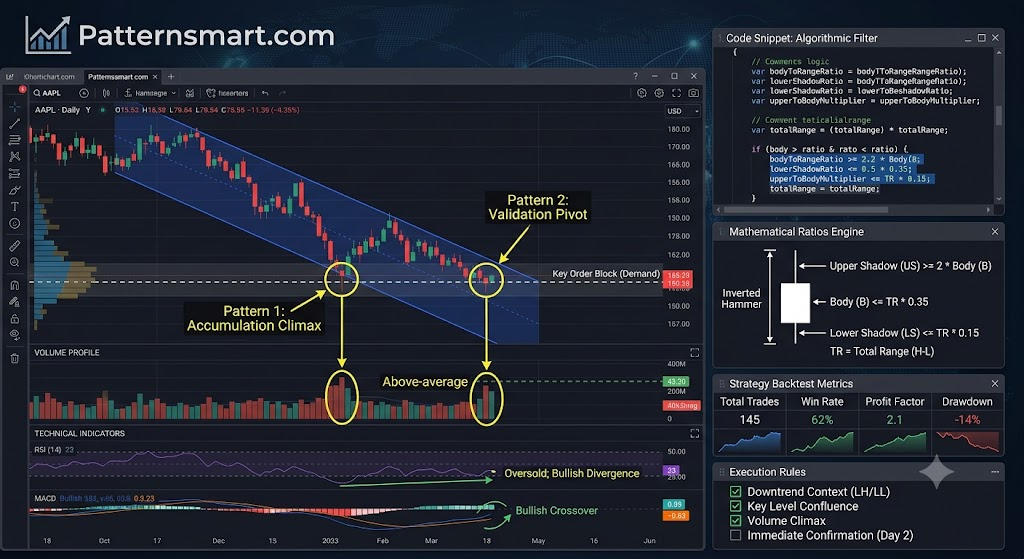
Anatomy of the Inverted Hammer
The Inverted Hammer is a single-session candlestick pattern characterized by its unique geometric asymmetry. It prints exclusively at the bottom of an established downtrend, mapping a brief but highly significant intraday power struggle.
To validate an Inverted Hammer for professional execution, the session must satisfy three core structural parameters:
- The Small Real Body: The distance between the open and close must be relatively narrow. The body prints entirely within the lower third of the session’s total price range. The color of the body is secondary—though a green (bullish) body carries slightly higher immediate reversal probability, a red (bearish) body is still structurally valid.
- The Extended Upper Shadow: The upper wick must be exceptionally long, measuring at least two to three times the length of the real body. This shadow represents an intra-session bullish rally that was ultimately pushed back by sellers before the close.
- The Negligible Lower Shadow: The lower wick must be virtually nonexistent or extremely minor. The session open (for green bodies) or close (for red bodies) should occur very close to the absolute low of the period, confirming that bears were unable to press price to fresh structural lows.
The Underlying Market Mechanics
Evaluating an Inverted Hammer purely by its appearance often leads to misinterpretation. Superficially, the long upper wick looks like a failed rally—a sign of selling pressure. However, when placed in the context of a prolonged downtrend, the internal order flow reveals a very different narrative:
- The Initial Liquidity Test: The session begins with the prevailing downtrend attempting to continue, but it quickly encounters a wave of institutional limit orders. Buyers aggressively drive the price upward to test the strength of overhead supply.
- The Counter-Attack: Late-stage short-sellers and trapped bears step in to defend their positions, driving the price back down toward the session’s lows by the time the candle closes.
- The Structural Shift: Although the bulls surrendered their intraday gains, the critical takeaway is that bears lacked the momentum to push price below the opening range. The extended upper wick proves that buyers have successfully broken the bearish monopoly, demonstrating an ability to drive price higher for the first time in the markdown cycle.
Technical Validation & Confluence Filters
Because the Inverted Hammer is a single-bar pattern, trading it in isolation introduces high tail risk. To separate true structural pivots from minor bear-market relief rallies, systematic strategies rely on strong confluence filters.
1. Volume Expansion
The volume underlying the Inverted Hammer session must be significantly above the 20-period moving average. High volume coupled with a small real body is the classic footprint of climax accumulation. Millions of shares or contracts are changing hands, yet the price is refusing to drop further, indicating massive institutional absorption.
2. Immediate Follow-Through (The Confirmation Bar)
An Inverted Hammer is never traded blindly upon its close. Systematic execution requires a Confirmation Bar (Bar 2). This next candle must open firm and close as a strong, expanding bullish bar above the real body of the Inverted Hammer, verifying that the buying pressure from the previous session has sustained momentum.
3. Structural Location
The pattern’s validity multiplies when it prints directly on top of established market architecture:
- A historical high-volume node on the Volume Profile.
- An institutional order block or unmitigated demand zone.
- Extreme oversold readings on momentum oscillators (e.g., Daily RSI below 25) paired with a bullish divergence.
Systematic Execution Strategy
To strip emotion out of the entry process, the execution framework must remain completely mechanical.
| Execution Parameter | Strategy Specification |
| Trigger Condition | Market entry at the exact close of the Confirmation Bar, or a buy-stop order placed 1-2 ticks above the highest point of the Inverted Hammer’s upper wick. |
| Stop Loss Placement | Placed strictly 1–2 pips/ticks below the lowest point of the Inverted Hammer’s lower shadow/body. A breach of this low voids the accumulation thesis. |
| Take Profit Targets | Target 1: Placed at the first major descending swing high (liquidity pool) to achieve a 1:1.5 RRR. Target 2: Mapped to the next higher-timeframe resistance zone, aiming for a minimum 1:3 Risk-to-Reward Ratio (RRR). |
Please check our Bullish Patterns Indicator collection.
Coding an Inverted Hammer into a C# trading algorithm—such as for NinjaTrader 8 (NT8) or custom .NET backtesting engines—requires translating visual rules into rigid mathematical ratios.
Because an Inverted Hammer relies on the relative proportions of its body, upper shadow, and lower shadow, we use the total range ($High – Low$) as our baseline denominator.
Here is an institutional-grade breakdown of the mathematical logic and the clean, production-ready C# implementation.
The Mathematical Logic
To eliminate subjectivity, the algorithm must evaluate the three components of a candle relative to its total range ($TR$).
Let:
- $$\text{Total Range (TR)} = High – Low$$
- $$\text{Body} = |Close – Open|$$
- $$\text{Upper Shadow} = High – \max(Open, Close)$$
- $$\text{Lower Shadow} = \min(Open, Close) – Low$$
The Rules Engine:
- Trend Filter: The pattern must occur after a markdown phase. This is typically quantified by checking if the current close is lower than a moving average or if the recent swing structure is making lower lows.
- Upper Shadow Rule: The upper shadow must be at least twice the size of the real body:$$\text{Upper Shadow} \ge 2 \times \text{Body}$$
- Body Size Rule: The real body must be small relative to the total range (typically less than 35% of the total candle size):$$\text{Body} \le TR \times 0.35$$
- Lower Shadow Rule: The lower shadow must be very small (typically less than 10% or 15% of the total range):$$\text{Lower Shadow} \le TR \times 0.15$$
Production-Ready C# Code (NinjaTrader 8 Architecture)
Below is a highly optimized C# snippet designed to scan bars in real-time or historical series.
C#
using System;
using NinjaTrader.NinjaScript;
using NinjaTrader.Data;

namespace NinjaTrader.NinjaScript.Indicators
{
    public class InvertedHammerScanner : Indicator
    {
        // User-defined thresholds for optimization
        private double bodyToRangeRatio = 0.35;    // Body must be <= 35% of total range
        private double lowerShadowRatio = 0.15;    // Lower shadow must be <= 15% of total range
        private double upperToBodyMultiplier = 2.0; // Upper shadow must be >= 2x the body

        protected override void OnStateChange()
        {
            if (State == State.SetDefaults)
            {
                Name = "Inverted Hammer Scanner";
                CalculateOnBarClose = true;
                IsOverlay = true;
            }
        }

        protected override void OnBarUpdate()
        {
            // Ensure we have enough bars to calculate a basic trend filter (e.g., 20 periods)
            if (CurrentBar < 20) return;

            // 1. Calculate Core Mathematical Dimensions
            double openPrice  = Open[0];
            double highPrice  = High[0];
            double lowPrice   = Low[0];
            double closePrice = Close[0];

            double totalRange  = highPrice - lowPrice;
            double body        = Math.Abs(closePrice - openPrice);
            double maxOpenClose = Math.Max(openPrice, closePrice);
            double minOpenClose = Math.Min(openPrice, closePrice);

            double upperShadow = highPrice - maxOpenClose;
            double lowerShadow = minOpenClose - lowPrice;

            // Prevent division by zero on flat/illiquid bars
            if (totalRange <= 0) return;

            // 2. Trend Filter: Simple 20-period EMA check to confirm a downtrend context
            bool isDowntrend = Close[0] < EMA(20)[0];

            // 3. Evaluate Pattern Math Against Rules
            bool isBodySmall        = body <= (totalRange * bodyToRangeRatio);
            bool isLowerShadowSmall = lowerShadow <= (totalRange * lowerShadowRatio);
            bool isUpperShadowLong  = upperShadow >= (body * upperToBodyMultiplier);

            // Special case: If the body is absolute zero (Doji Inverted Hammer),
            // ensure upper shadow dominates the range
            if (body == 0)
            {
                isUpperShadowLong = upperShadow >= (totalRange * 0.60);
            }

            // 4. Trigger Signals
            if (isDowntrend && isBodySmall && isLowerShadowSmall && isUpperShadowLong)
            {
                // Action: Plot signal, log data, or trigger execution logic
                Log(string.Format("Inverted Hammer Detected at Bar {0} | Price: {1}", CurrentBar, closePrice), LogLevel.Information);

                // Visual marker for chart testing
                Draw.TriangleUp(this, "InvHammer_" + CurrentBar, true, 0, lowPrice - (TickSize * 5), Brushes.Green);
            }
        }
    }
}
Key Algorithmic Considerations
- Handling the Absolute Doji: If a bar opens and closes at the exact same price ($Body = 0$), the multiplier formula
upperShadow >= (body * 2)resolves to0 >= 0, which evaluates as true but loses its strictness. The code above resolves this by adding a fallback constraint: if the body is zero, the upper shadow must occupy at least 60% of the entire candle range. - The Trend Multiplier: Relying solely on
Close[0] < EMA(20)[0]can sometimes catch noisy pullbacks in a sideways market. For live institutional deployment, consider replacing the EMA check with a true market structure check, such as requiring the last two consecutive swing pivots to be lower highs and lower lows ($LH / LL$).