Introduction
The Mat Hold is a rare but highly reliable bullish continuation candlestick pattern that signals a temporary pause within an established uptrend before the prevailing bullish trend resumes. Unlike reversal patterns such as the Morning Star or Bullish Engulfing, the Mat Hold indicates that buyers remain firmly in control despite a brief period of profit-taking or consolidation.
The pattern reflects a healthy correction rather than a change in trend. It demonstrates that sellers are unable to generate meaningful downside momentum, allowing buyers to regain control and continue driving prices higher.
Because the Mat Hold appears infrequently, many traders overlook it. However, when it forms under the proper market conditions and is confirmed by volume and trend analysis, it can provide an excellent opportunity to enter an existing bullish trend with favorable risk-to-reward characteristics.
What is a Mat Hold Pattern?
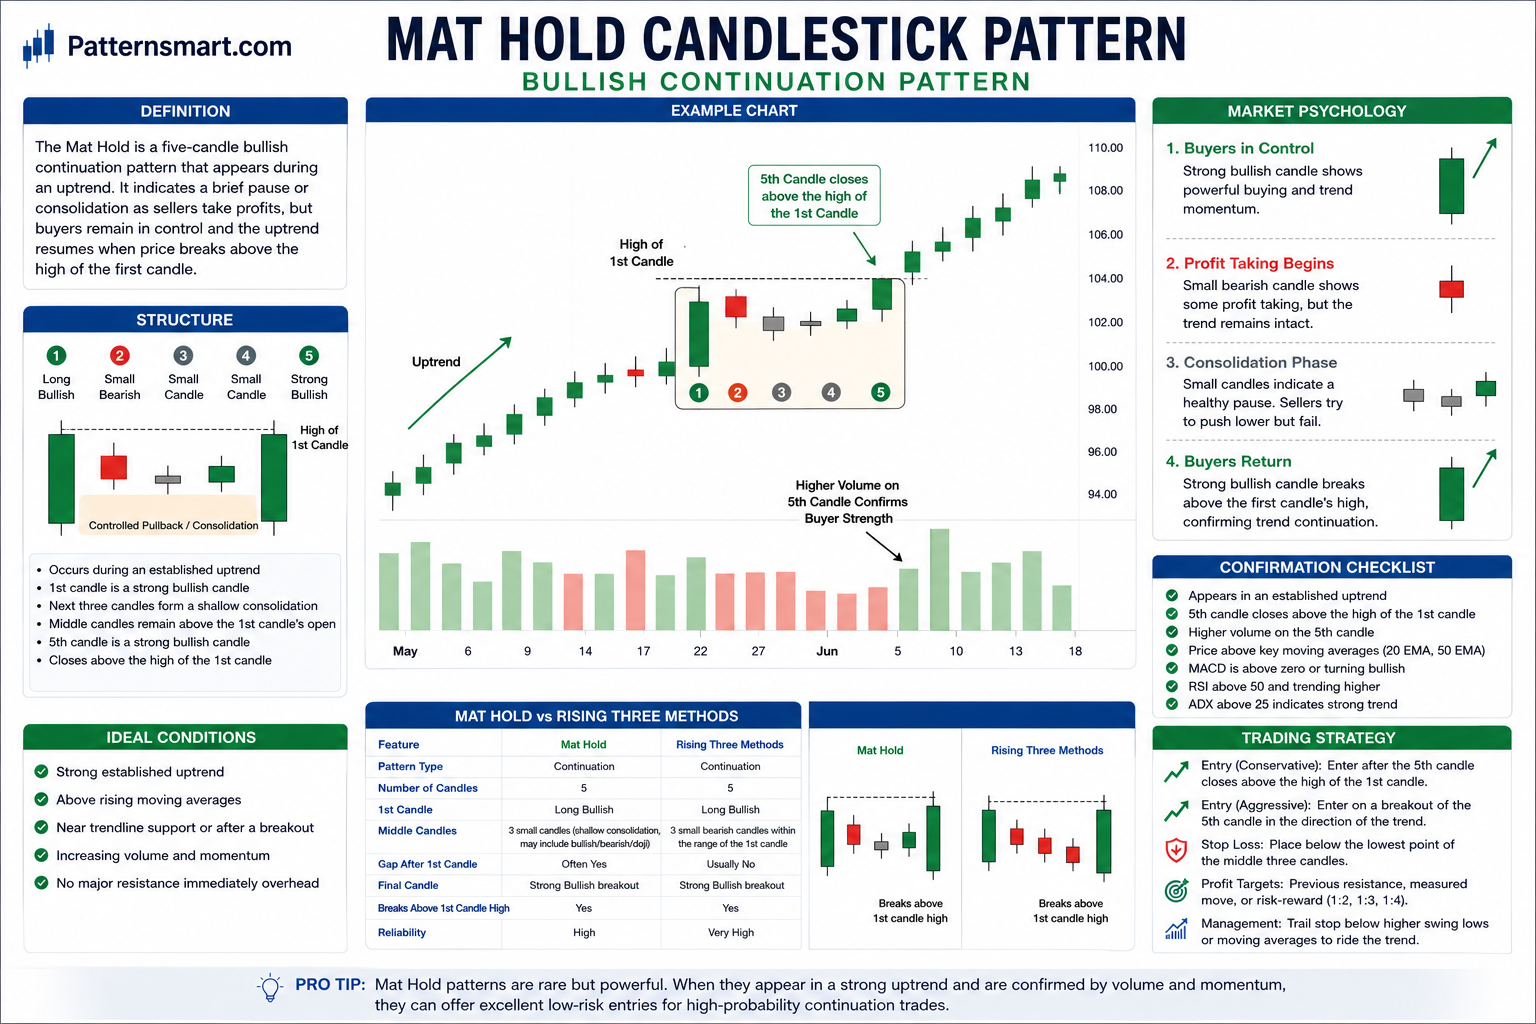
The Mat Hold is a five-candle bullish continuation pattern that develops during an existing uptrend.
It consists of:
- First Candle
- A long bullish (green/white) candle.
- Continues the existing uptrend with strong buying pressure.
- Second Candle
- Opens with a gap higher (more common in stocks and futures).
- Forms a small bearish candle.
- Begins a short-term pullback.
- Third Candle
- Small-bodied candle.
- Trades lower but remains above the first candle’s opening price.
- Selling pressure remains limited.
- Fourth Candle
- Another small candle.
- Continues the consolidation without breaking the overall bullish structure.
- Buyers quietly absorb selling pressure.
- Fifth Candle
- A strong bullish candle.
- Closes above the high of the first candle.
- Confirms the continuation of the uptrend.
The three middle candles collectively represent a controlled pullback rather than a reversal.
Visual Structure
                Mat Hold Pattern

1st          2nd        3rd        4th        5th

Bullish      Small      Small      Small      Strong
Bullish      Bearish    Mixed      Bullish    Bullish

 ██████         ██         ▒▒         ▒▒      █████████
 ██████         ██         ▒▒         ▒▒      █████████
 ██████         ██         ▒▒         ▒▒      █████████
 ██████         ██         ▒▒         ▒▒      █████████

Strong Uptrend → Controlled Pullback → Trend Resumes
Key characteristics:
- Appears during an established uptrend
- Five-candle formation
- First candle is strongly bullish
- Middle three candles represent a shallow consolidation
- Final candle breaks above the first candle’s high
- Signals bullish trend continuation
Market Psychology Behind the Pattern
The Mat Hold reflects the market’s ability to absorb temporary selling pressure without changing the primary trend.
Stage 1 – Buyers Dominate
The first candle is a long bullish candle.
During this session:
- Buyers aggressively push prices higher.
- Momentum remains strong.
- Confidence in the uptrend increases.
The market is clearly bullish.
Stage 2 – Profit Taking Begins
The second candle opens higher but closes slightly lower.
This reflects:
- Short-term profit taking.
- Reduced buying momentum.
- Limited selling pressure.
Importantly, bears fail to reverse the trend.
Stage 3 – Controlled Consolidation
The third and fourth candles continue the pullback.
During this phase:
- Sellers attempt to push prices lower.
- Buyers absorb available supply.
- Price remains well above major support.
Rather than signaling weakness, this consolidation allows the market to digest previous gains.
Stage 4 – Buyers Return
The fifth candle rallies strongly.
This indicates:
- Institutions resume buying.
- Sellers are overwhelmed.
- Fresh momentum enters the market.
The close above the first candle’s high confirms that the correction has ended and the primary uptrend has resumed.
Why the Pullback is Important
The middle three candles represent a healthy pause, not a reversal.
A successful Mat Hold requires that:
- The pullback remains relatively shallow.
- Price does not violate the first candle’s opening price.
- Selling pressure steadily diminishes.
- Buyers quickly regain control.
This behavior demonstrates strong underlying demand.
Ideal Market Conditions
The Mat Hold performs best when it appears:
- During a strong established uptrend
- After a significant bullish breakout
- Above rising moving averages
- Near trendline support
- During institutional accumulation
- With increasing market participation
Avoid trading the pattern during:
- Sideways markets
- Weak or uncertain trends
- Highly volatile consolidations
- Major resistance zones
Confirmation Signals
Professional traders seek additional confirmation before entering.
Increasing Volume
Higher volume during the fifth candle significantly strengthens the continuation signal.
Moving Averages
The pattern is more reliable when price remains above:
- 20 EMA
- 50 EMA
- 50 SMA
MACD
A rising MACD histogram or bullish crossover confirms strengthening momentum.
RSI
An RSI holding above 50 while avoiding extreme overbought conditions supports continuation.
ADX
An ADX above 25 suggests a strong trend is already in place, increasing the probability of a successful continuation.
Trading Strategy
Conservative Entry
Wait for:
- The fifth candle to close above the first candle’s high.
- Confirmation from increased volume.
- Continued bullish momentum.
Advantages:
- Higher probability
- Reduced false breakouts
Disadvantages:
- Slightly later entry
Aggressive Entry
Enter during the breakout of the fifth candle.
Advantages:
- Better reward-to-risk ratio
- Earlier participation
Disadvantages:
- Greater exposure to false breakouts
Stop Loss Placement
Common stop-loss locations include:
Below the Lowest Middle Candle
The most common placement.
If price falls below the consolidation, the continuation pattern has likely failed.
Below the Pattern Low
Suitable for swing traders seeking additional protection against short-term volatility.
Below Trend Support
When the pattern forms near a rising trendline or moving average, stops may be placed just below those support levels.
Profit Targets
Several exit strategies may be used.
Previous Resistance
Target the next major resistance level.
Measured Move
Project the height of the initial impulse and apply it from the breakout point.
Risk-to-Reward Ratio
Professional traders often target:
- 1:2
- 1:3
- 1:4
risk-to-reward ratios.
Trailing Stop
Ride extended trends using:
- Higher swing lows
- Moving averages
- ATR trailing stops
Mat Hold vs Rising Three Methods
| Feature | Mat Hold | Rising Three Methods |
|---|---|---|
| Pattern Type | Continuation | Continuation |
| Number of Candles | 5 | 5 |
| First Candle | Long Bullish | Long Bullish |
| Middle Candles | Controlled pullback with possible gap | Three small bearish candles within first candle’s range |
| Final Candle | Strong bullish breakout | Strong bullish breakout |
| Gap Required | Often present | Usually absent |
| Reliability | Slightly higher in trending markets | Very High |
Both patterns signal bullish continuation, but the Mat Hold typically includes a gap after the first candle and a tighter consolidation.
Common Mistakes
Trading Without an Existing Uptrend
The Mat Hold is a continuation pattern.
Without an established bullish trend, the pattern loses much of its significance.
Ignoring Volume
A weak breakout on low volume may indicate insufficient buying conviction.
Confusing with a Reversal
The middle candles represent consolidation, not bearish reversal.
Selling prematurely may result in missing the continuation move.
Buying Into Strong Resistance
Even strong continuation patterns may stall beneath significant resistance.
Ignoring Trend Strength
Patterns forming during weak trends have a lower probability of success.
Always evaluate the broader market context.
Advantages
- High-probability continuation signal
- Reflects healthy trend consolidation
- Excellent risk-to-reward opportunities
- Works across multiple asset classes
- Combines well with moving averages and momentum indicators
- Particularly effective during strong trending markets
Limitations
- Rare compared to other candlestick patterns
- Requires an established uptrend
- Less effective during ranging markets
- Needs confirmation from price action and volume
- Can produce false breakouts during volatile conditions
Best Markets
The Mat Hold performs well in:
- Stocks
- Forex
- Cryptocurrencies
- Futures
- Commodities
- ETFs
- Stock indices
Applicable timeframes include:
- 15-minute charts
- Hourly charts
- 4-hour charts
- Daily charts
- Weekly charts
Higher timeframes generally produce more reliable continuation signals.
Professional Trading Tips
Experienced traders often improve the reliability of the Mat Hold by following these principles:
- Only trade the pattern within a strong existing uptrend.
- Ensure the middle three candles remain relatively shallow and orderly.
- Look for above-average volume on the fifth bullish candle.
- Confirm the trend with moving averages, MACD, RSI, or ADX.
- Wait for a decisive breakout above the first candle’s high before entering conservatively.
- Place stop losses beneath the consolidation area rather than too close to the breakout.
- Always evaluate nearby resistance levels and maintain a favorable risk-to-reward ratio.
Conclusion
The Mat Hold is one of the most distinctive and reliable bullish continuation candlestick patterns, illustrating how a strong uptrend can temporarily pause before resuming. Its five-candle structure captures a sequence of powerful buying, controlled profit-taking, orderly consolidation, and renewed bullish momentum, making it an excellent signal that the prevailing trend remains intact.
Although relatively uncommon, the Mat Hold can offer high-quality trading opportunities when it appears within a well-established uptrend and is supported by strong volume, rising moving averages, and bullish momentum indicators. As with any technical pattern, it should not be used in isolation. Combining the Mat Hold with broader trend analysis, support and resistance, and disciplined risk management can significantly improve trading outcomes across stocks, forex, cryptocurrencies, futures, and other financial markets.
Please check our Bullish Patterns Indicator collection.