The Long-Legged Doji is a single-candle pattern that signifies a state of dramatic, high-volatility equilibrium. It represents a fierce battle between buyers and sellers where massive ground was gained and lost by both sides, only for the price to end up exactly where it started.
While a standard Doji represents quiet crosscurrents and low volatility, a Long-Legged Doji reflects extreme intra-session instability. It is a major warning sign that the prevailing trend is losing its structural backing.
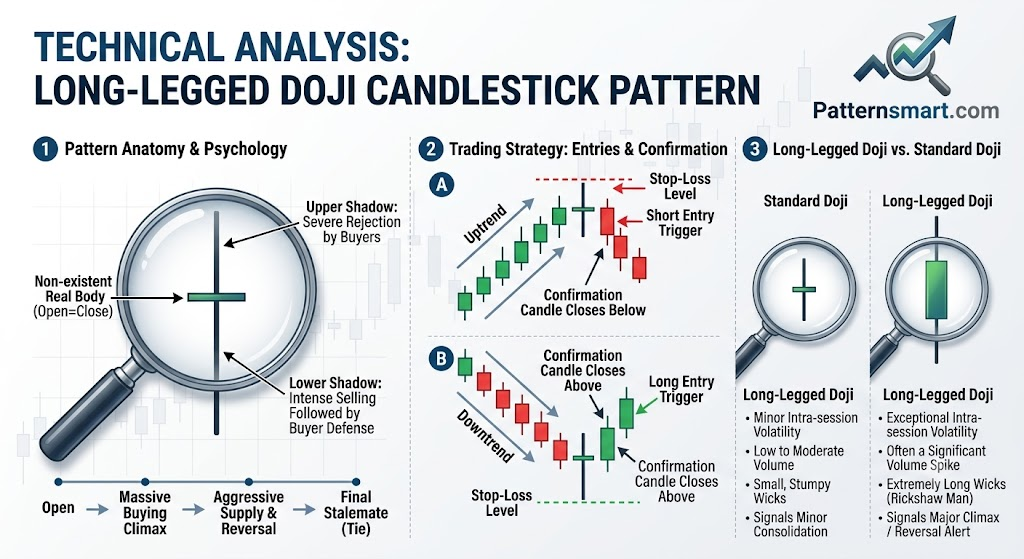
Anatomy of a Long-Legged Doji
The visual structure of a Long-Legged Doji is distinct and unmistakable due to the massive extension of its upper and lower wicks (shadows).
Structural Criteria:
- The Real Body: The open and close prices must be nearly identical, forming a thin, horizontal line rather than a thick body.
- The Wicks: Both the upper shadow and lower shadow are exceptionally long, stretching far beyond the average candle size of the preceding sessions.
- Symmetry (Rickshaw Man): If the open and close sit roughly in the exact center of the candle’s total range, the pattern is technically referred to as a Rickshaw Man. If the thin real body is skewed toward the top or bottom, it still falls under the broad category of a Long-Legged Doji.
The Market Psychology: Violent Tug-of-War
To appreciate the predictive power of this candle, we have to visualize the timeline of its formation:
- The Opening: The session opens, and one group immediately takes massive control. If it prints during an uptrend, bulls initially rocket the price upward to new highs.
- The Counter-Attack: At the peak, aggressive supply or profit-taking hits the market. The price reverses entirely, and sellers drive the asset all the way down, slicing past the opening price to print deep new lows.
- The Stalemate: Just as the bears look like they are winning, buyers step in at the absolute lows. They bid the price back up to the initial baseline before the closing bell rings.
The ultimate takeaway is exhaustion. Both sides spent immense capital and volume attempting to establish dominance, yet neither could hold their ground.
Strategic Trading Applications
Because a Long-Legged Doji represents a pure tie, it is a neutral pattern in isolation. Its directional bias depends entirely on the surrounding market structure.
1. The Climax Trend Reversal
When a Long-Legged Doji prints after an extended, multi-week uptrend or downtrend, it acts as a strong reversal signal. It means the directional momentum has burned out.
- At Market Tops: It signals that the supply side has effectively absorbed the final wave of buying pressure.
- At Market Bottoms: It signals that demand has stepped in to stop the bleeding.
2. Entry Triggers and Confirmation
Never enter a trade based solely on a Long-Legged Doji, as the market can consolidate sideways following such high volatility. Always wait for the subsequent candle (Candle 2) to break the boundaries:
- Short Entry Trigger: If the Doji appears at an overextended high, wait for a subsequent candle to close below the lowest wick of the Long-Legged Doji.
- Long Entry Trigger: If the Doji appears at an oversold support level, wait for a subsequent candle to close above the highest wick of the Long-Legged Doji.
3. Risk Management & Stop-Loss Levels
The wide wicks of the Long-Legged Doji provide clean structural lines for setting stop losses:
- For Short Positions: Place the stop-loss just above the highest point of the upper wick.
- For Long Positions: Place the stop-loss just below the lowest point of the lower wick.
Comparison: Long-Legged Doji vs. Standard Doji
| Attribute | Standard Doji | Long-Legged Doji |
| Intra-session Volatility | Low to Moderate | Exceptionally High |
| Wick Length | Short / Stumpy | Extremely Long |
| Market Volume | Often lower than average | Often a significant volume spike |
| Trading Context | Minor pause or consolidation | Major structural turning point / climax |
When you see a Long-Legged Doji appear on high volume, it means the market is throwing up a major caution flag. It is time to tighten stops, protect open profits, and wait for the next breakout direction to clarify itself.
Please check our Bearish and Bullish Patterns Indicator collection.