In systematic technical analysis, identifying where a markdown phase loses momentum and shifts into a accumulation phase is a primary objective. While three-bar reversal patterns like the Morning Star are highly popularized, the Matching Low is a nuanced, two-bar bullish reversal pattern that offers distinct structural insight into institutional defense lines.
When identified at major liquidity pools, the Matching Low provides systematic traders with a high-probability setup featuring tightly defined risk boundaries.
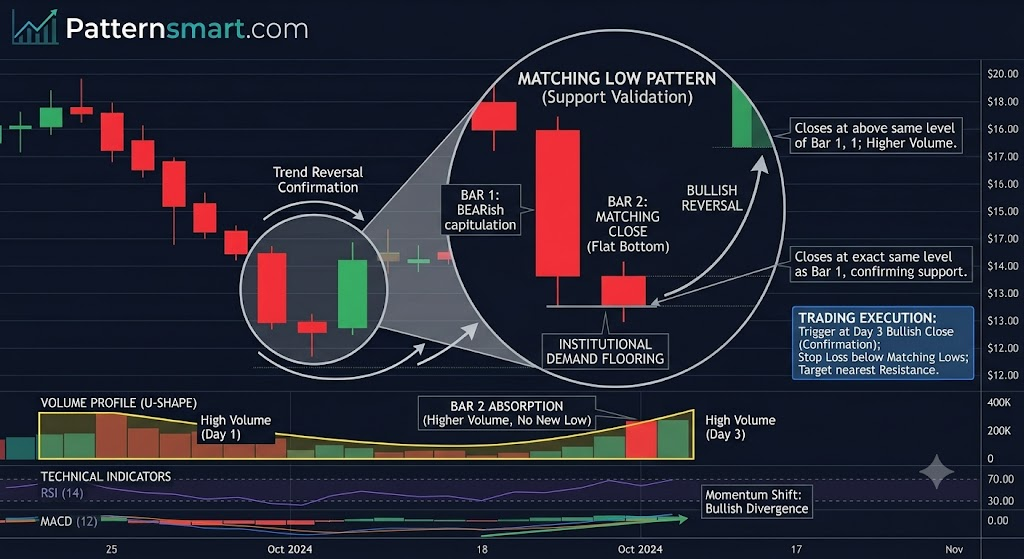
Anatomy of the Matching Low
The Matching Low is a two-candle bullish reversal pattern that characterizes a sudden halt in bearish momentum. It represents a specific psychological milestone: the market’s refusal to accept lower prices despite a dominant downtrend.
To validate a Matching Low formation for institutional execution, the sequence must satisfy three strict structural rules:
- Bar 1 (The Initial Bearish Drive): A large, red (or black) candlestick prints in alignment with the prevailing downtrend. This bar demonstrates strong selling pressure and expanding bearish momentum.
- Bar 2 (The Matching Close): The second candlestick opens higher than the close of Bar 1, creating a minor intra-session gap or immediate pushback from buyers. It then sells off, but crucially, its close matches the exact or near-exact closing price of Bar 1.
- The Flat Bottom: The structural hallmark of this pattern is the creation of two consecutive candles with identical or nearly identical closing levels, creating a distinct, horizontal support floor. Bar 2 typically lacks a significant lower wick, signaling that selling pressure ceased precisely at that coordinate.
The Underlying Market Mechanics
Looking beyond the visual geometry reveals a narrative of supply absorption and institutional limit orders.
- The Bear Trap: Bar 1 indicates that sellers are firmly in control. When Bar 2 opens and attempts to push lower again, retail trend-followers often enter fresh short positions, anticipating a breakdown.
- Institutional Demand Flooring: As price approaches the closing level of Bar 1, it hits a massive block of institutional buy-limit orders. Instead of breaking through, the supply is entirely absorbed by large-scale buyers who are unwilling to let the asset depreciate any further.
- The Liquidity Pool: By closing at the exact same level twice, the market establishes a highly visible short-term floor. This traps late-stage short sellers and builds up buy-stop liquidity just above the pattern’s highs, which serves as fuel for the impending upward reversal.
Technical Validation & Filters
Because the Matching Low is a two-candle pattern, it lacks an embedded confirmation bar within its own structure. Therefore, systematic strategies require secondary filters to confirm validity and avoid catching a “falling knife.”
1. Volume Profile Delta
The distribution of volume across the two sessions provides vital clues about institutional intent:
- Bar 1: High volume, indicating active liquidation.
- Bar 2: Equal or higher volume than Bar 1, despite a much smaller real body. This volume divergence is the definitive footprint of absorption—heavy transactional activity is occurring, but the price is no longer moving lower because buyers are absorbing every sell order.
2. Higher-Timeframe Confluence
A Matching Low should never be traded blindly in a vacuum. Its predictive power multiplies exponentially when it prints precisely at:
- A major daily or weekly support zone.
- The lower boundary of a long-term ascending channel.
- Oversold territory on momentum oscillators (e.g., RSI < 30) displaying bullish divergence.
Systematic Execution Strategy
To eliminate emotional bias, execution based on the Matching Low pattern must follow a rigid, rule-based framework.
| Execution Parameter | Strategy Specification |
| Trigger Condition | Conservative: Wait for Bar 3 (the confirmation bar) to close as a strong bullish candle, then enter long market. Aggressive: Place a buy-stop order just above the high of Bar 2 to catch the immediate short-covering breakout. |
| Stop Loss Placement | Set strictly 1–2 pips/ticks below the matching closing lows of Bar 1 and Bar 2 (or below the lowest wick if a minor shadow exists). |
| Take Profit Targets | Target 1: Placed at the nearest minor swing high to secure a 1:1 risk-to-reward ratio. Target 2: Placed at a key overhead supply zone, targeting a minimum 1:2.5 Risk-to-Reward Ratio (RRR). |
Please check our Bullish Patterns Indicator collection.