Introduction
The Morning Doji Star is one of the most reliable bullish reversal candlestick patterns in technical analysis. It typically appears after a prolonged downtrend and signals that bearish momentum is fading while buyers are beginning to take control. Because it incorporates a Doji, which represents market indecision, the pattern provides stronger evidence of a potential trend reversal than the standard Morning Star pattern.
Professional traders often view the Morning Doji Star as a high-probability reversal signal when it forms at major support levels, Fibonacci retracement zones, trendlines, or after oversold readings from momentum indicators such as RSI, MACD, or Stochastic Oscillator.
Although highly respected, the Morning Doji Star should always be confirmed by additional technical factors such as volume, trend analysis, and follow-through price action before initiating a trade.
What is a Morning Doji Star Pattern?
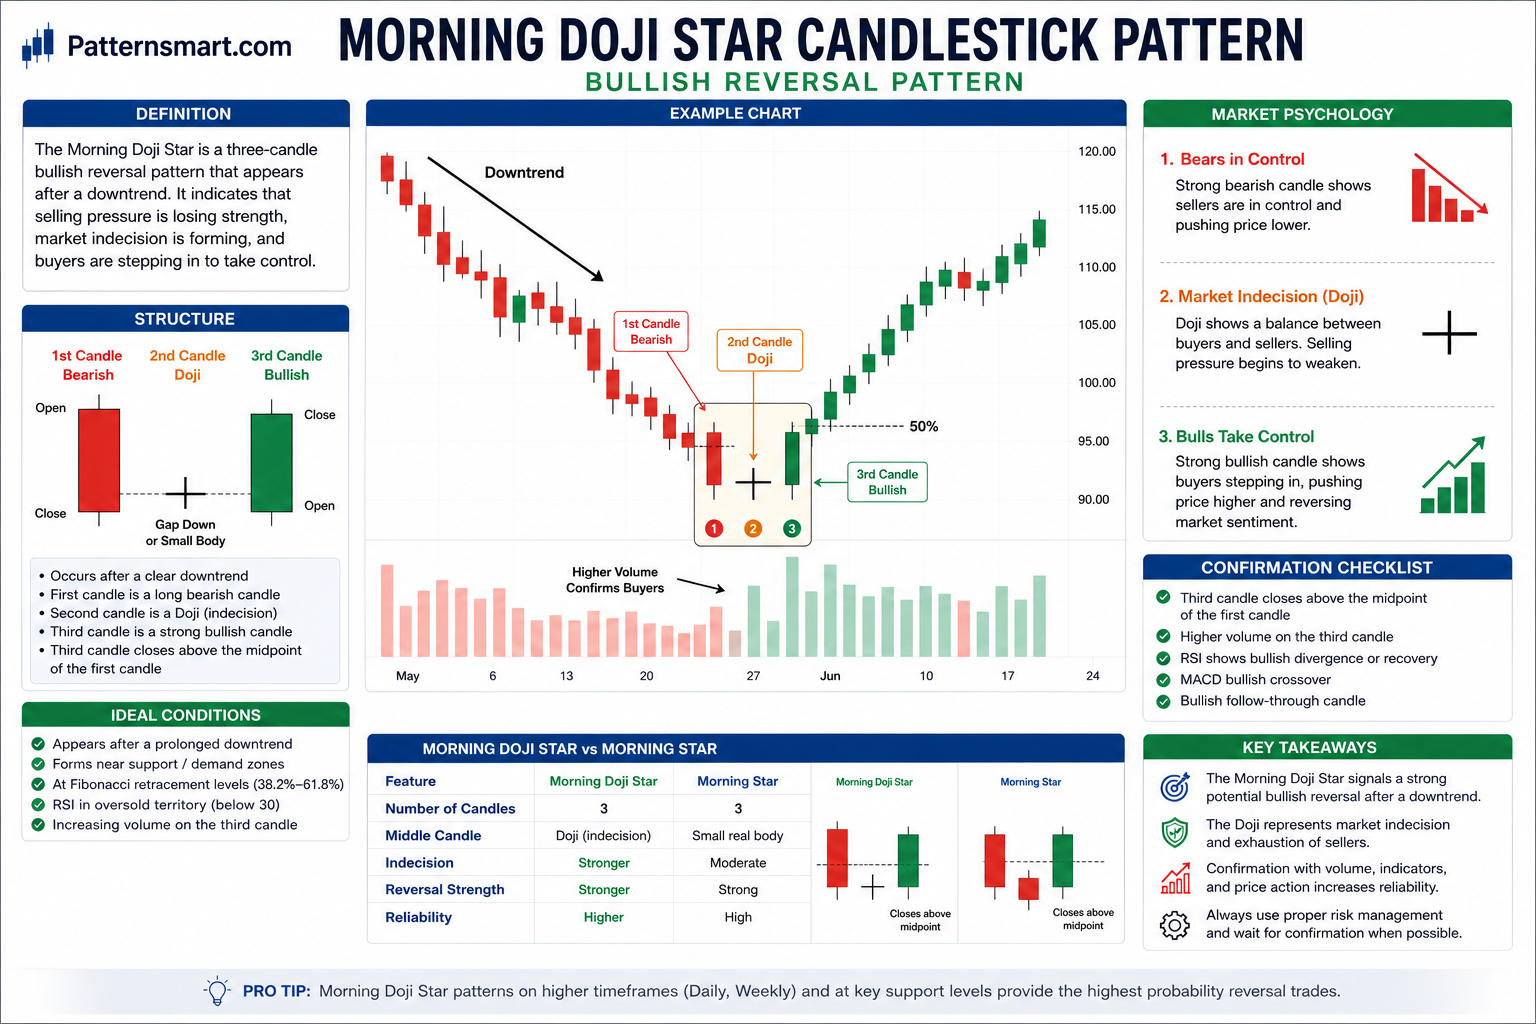
The Morning Doji Star is a three-candle bullish reversal pattern that forms after a clear downtrend.
It consists of:
- First Candle
- A long bearish (red/black) candle.
- Demonstrates strong selling pressure.
- Continues the existing downtrend.
- Second Candle
- A Doji, where the opening and closing prices are nearly identical.
- Represents market indecision.
- Often gaps below the first candle in stocks and futures.
- Third Candle
- A strong bullish (green/white) candle.
- Opens above or near the Doji.
- Closes well into the body of the first bearish candle, ideally above its midpoint.
The pattern reflects a transition from strong selling pressure to indecision, followed by decisive buying.
Visual Structure
           Morning Doji Star

First Candle        Second Candle         Third Candle

 Bearish              Doji                 Bullish

 ┌─────┐               ──               ┌─────┐
 │     │                                │█████│
 │     │                                │█████│
 │     │                +               │█████│
 │     │                                │█████│
 └─────┘                                └─────┘

Strong Selling      Indecision        Buyers Take Control
Key characteristics:
- Appears after a clear downtrend
- Three-candle formation
- First candle is strongly bearish
- Middle candle is a Doji
- Third candle is strongly bullish
- Third candle closes above the midpoint of the first candle
- Signals a bullish reversal
Market Psychology Behind the Pattern
The Morning Doji Star illustrates the gradual shift in control from sellers to buyers.
Stage 1 – Bears Dominate
The first candle is a long bearish candle.
During this session:
- Sellers aggressively push prices lower.
- Market sentiment remains pessimistic.
- Most traders expect the downtrend to continue.
Bears are clearly in control.
Stage 2 – Market Becomes Uncertain
The second candle forms a Doji.
A Doji reflects balance between buyers and sellers.
During this session:
- Selling pressure weakens.
- Buyers begin defending lower prices.
- Neither side gains a decisive advantage.
The market pauses after the decline.
This loss of bearish momentum is the first warning that a reversal may be developing.
Stage 3 – Bulls Take Control
The third candle opens near the Doji and rallies strongly throughout the session.
This demonstrates:
- Aggressive buying interest.
- Short covering by bearish traders.
- Increased market confidence.
When the third candle closes above the midpoint of the first candle, buyers have successfully reclaimed much of the previous decline.
The market sentiment shifts from bearish to bullish.
Why the Doji Makes the Pattern Stronger
The Doji is the defining feature of the Morning Doji Star.
Unlike a small-bodied candle in a regular Morning Star, the Doji indicates:
- Complete hesitation
- Exhaustion of sellers
- Temporary equilibrium between buyers and sellers
This indecision often precedes major trend reversals because it reflects the weakening conviction of the prevailing trend.
Ideal Market Conditions
The Morning Doji Star is most effective when it appears:
- After an established downtrend
- Near long-term support
- At Fibonacci retracement levels
- Around moving averages
- Following capitulation selling
- After oversold momentum readings
The pattern is less reliable during:
- Sideways markets
- Low-volatility consolidations
- Strong bearish breakouts
- Thinly traded securities
Confirmation Signals
Professional traders rarely trade the pattern without confirmation.
Useful confirmation methods include:
Increasing Volume
Higher volume during the third bullish candle suggests institutional buying and strengthens the reversal signal.
RSI Oversold
An RSI reading below 30 followed by a Morning Doji Star often signals a high-probability reversal.
MACD Bullish Crossover
A bullish MACD crossover shortly after the pattern confirms improving momentum.
Stochastic Bullish Cross
A bullish crossover in the oversold zone reinforces the reversal.
Support Levels
The pattern becomes significantly stronger when it forms near:
- Horizontal support
- Weekly support
- Trendline support
- Fibonacci retracement levels
- Previous swing lows
Trading Strategy
Conservative Entry
Wait for:
- The candle following the Morning Doji Star to close above the third candle’s high.
- Confirmation from increasing volume or momentum indicators.
Advantages:
- Higher probability
- Reduced false signals
Disadvantages:
- Later entry
- Smaller reward potential
Aggressive Entry
Enter immediately after the third bullish candle closes.
Advantages:
- Better risk-to-reward ratio
- Earlier participation
Disadvantages:
- Greater chance of false reversals
Stop Loss Placement
Common stop-loss locations include:
Below the Doji Low
The most common placement.
If price falls below the Doji, the reversal has likely failed.
Below the Pattern Low
Provides additional room for market volatility.
Suitable for swing traders.
Below Major Support
When the pattern forms at a significant support level, placing the stop slightly below that support can reduce the chance of being stopped out by normal price fluctuations.
Profit Targets
Several profit-taking methods can be used.
Previous Resistance
Exit near the next significant resistance level.
Risk-to-Reward Ratio
Many professional traders target:
- 1:2
- 1:3
- 1:4
risk-to-reward ratios.
Trailing Stop
Ride larger trends using:
- Swing lows
- Moving averages
- ATR trailing stops
Morning Doji Star vs Morning Star
| Feature | Morning Doji Star | Morning Star |
|---|---|---|
| Number of Candles | 3 | 3 |
| Middle Candle | Doji | Small real body |
| Indicates Stronger Indecision | Yes | Moderate |
| Reversal Strength | Stronger | Strong |
| Reliability | Higher | High |
Because the middle candle is a Doji, the Morning Doji Star generally provides stronger evidence that bearish momentum has been exhausted.
Common Mistakes
Trading Without a Prior Downtrend
The Morning Doji Star is a reversal pattern.
Without a preceding decline, its significance is greatly reduced.
Ignoring Confirmation
Entering before the third candle closes may result in false signals.
Always wait for confirmation whenever possible.
Ignoring Volume
Low-volume reversals are less reliable than those supported by strong buying activity.
Buying Directly Into Resistance
Even a strong reversal pattern may fail if major resistance is located immediately overhead.
Using the Pattern Alone
The highest-probability trades combine the Morning Doji Star with:
- Support and resistance analysis
- Volume confirmation
- RSI
- MACD
- Stochastic Oscillator
- Moving averages
- Fibonacci retracements
Advantages
- One of the strongest bullish reversal patterns
- Easy to recognize
- Strong market psychology
- Excellent early reversal signal
- Works across multiple financial markets
- Effective on multiple timeframes
- Combines well with technical indicators
Limitations
- Requires confirmation
- Less effective in sideways markets
- Can produce false signals during strong bear trends
- Volume confirmation is highly desirable
- Not every Morning Doji Star leads to a sustained reversal
Best Markets
The Morning Doji Star performs well in:
- Stocks
- Forex
- Cryptocurrencies
- Futures
- Commodities
- ETFs
- Stock indices
Applicable to:
- 5-minute charts
- 15-minute charts
- Hourly charts
- Daily charts
- Weekly charts
Patterns forming on higher timeframes generally carry greater significance.
Professional Trading Tips
Experienced traders often enhance the reliability of the Morning Doji Star by following these guidelines:
- Focus on patterns that appear after extended downtrends.
- Give greater weight to setups that form near established support levels.
- Look for above-average volume during the third bullish candle.
- Confirm the reversal with momentum indicators such as RSI, MACD, or Stochastic.
- Wait for a bullish follow-through candle when trading conservatively.
- Place stop losses below the Doji or the pattern low to control risk.
- Combine the pattern with a favorable risk-to-reward ratio before entering a trade.
Conclusion
The Morning Doji Star is widely regarded as one of the most dependable bullish reversal candlestick patterns because it clearly illustrates the transition from strong selling pressure to market indecision and finally to decisive buying. The presence of the Doji makes this pattern particularly meaningful, as it signals that bearish momentum has stalled before buyers seize control.
When the pattern forms after a sustained downtrend, near a significant support level, and is supported by increasing volume or bullish momentum indicators, it can provide an excellent early indication of a trend reversal. However, no candlestick pattern is infallible. Traders should always seek confirmation, manage risk with appropriate stop-loss placement, and integrate the Morning Doji Star into a broader technical analysis strategy rather than relying on it as a standalone signal. Used in this disciplined manner, the Morning Doji Star can be a powerful tool for identifying high-probability bullish reversal opportunities across stocks, forex, cryptocurrencies, futures, and other financial markets.
Please check our Bullish Patterns Indicator collection.