In systematic technical analysis, identifying the exact coordinates where an aggressive market auction hits an immediate wall of opposing liquidity is a primary objective. While continuation structures track ongoing trend velocity, the Meeting Lines (also known as Counterattack Lines) is a sharp, two-bar reversal pattern that flags an instantaneous shift in structural control.
When it prints at key high-timeframe architectural levels, this pattern gives quantitative and discretionary traders a high-probability framework to capture swift pivot turns.
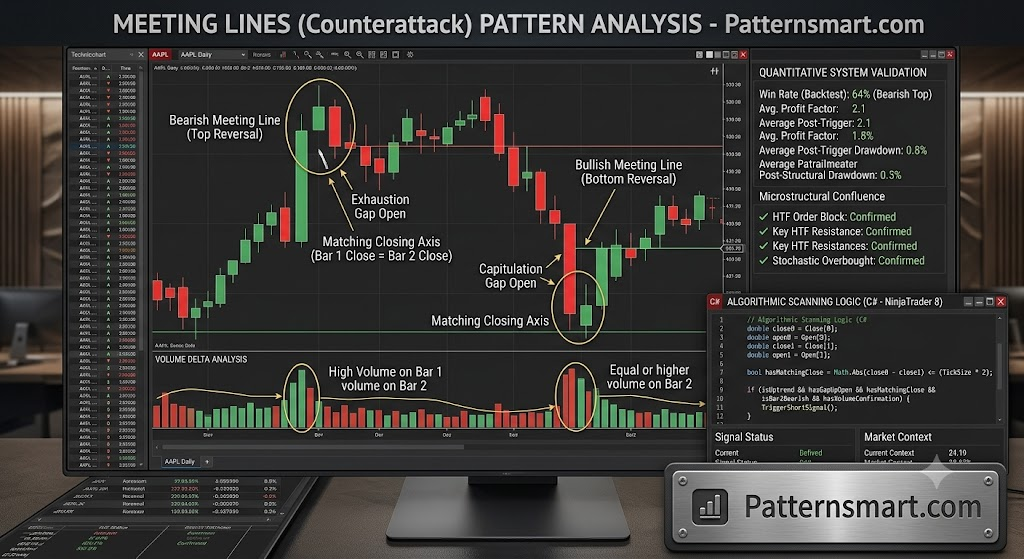
Anatomy of the Meeting Lines Pattern
The Meeting Lines pattern is a two-bar configuration that can appear in both bullish (bottom) and bearish (top) market regimes. It represents a dramatic tug-of-war where an initial opening gap is entirely erased by the closing bell, bringing the two sessions into a shared closing equilibrium.
To validate the formation for institutional-grade screening, the structure must satisfy three rigid geometric criteria:
The Bearish Meeting Line (Top Reversal)
- Bar 1 (The Trend Extension): A long, green (bullish) candle prints in the direction of the established uptrend, demonstrating dominant buying momentum.
- The Gap Open: Bar 2 opens with a sharp, aggressive gap upward, significantly above the closing print of Bar 1. This represents a final rush of retail buyers or breakout momentum engines chasing the trend.
- The Counterattack Close: From its open, Bar 2 immediately encounters heavy supply. Sellers drive the price down throughout the session. Crucially, the closing price of Bar 2 must match, or be within a razor-thin tolerance of, the closing price of Bar 1.
The Bullish Meeting Line (Bottom Reversal)
- Bar 1: A long, red (bearish) candle prints firmly within a dominant downtrend.
- The Gap Open: Bar 2 gaps down sharply on the open, trading deep into fresh relative lows.
- The Counterattack Close: Demand floods the order book, forcing short covering and fresh long positioning. Bar 2 rallies heavily to close at the exact same price level as Bar 1’s close.
Underlying Market Mechanics and Order Flow
Evaluating the pattern purely on a visual chart setup misses the institutional dynamics taking place inside the order book:
- The Exhaustion Gap: The opening gap of Bar 2 acts as an exhaustion print. In a bullish trend, it represents the final exhaustion of motivated market-buy orders.
- The Institutional Wall: As the price spikes out of the opening bell, it runs directly into a thick cluster of institutional passive limit orders (Supply or Demand zones). The market cannot breach this wall.
- The Trapped Breakout Engine: Traders who entered on the breakout of Bar 2’s open find themselves instantly off-side as the counter-drive begins. As the session progresses, their protective stops are hit, or they are forced to manually liquidate, adding mechanical fuel to the reversal drive.
- The Equilibrium Print: The fact that the second bar closes exactly at the previous session’s close proves that the initial momentum has been completely neutralized. The aggressive party has been entirely checked, resetting the local market structure.
Technical Validation and Filters
Because a two-bar pattern carries less historical weight than multi-bar consolidations, systematic trading strategies implement strict confirmation filters.
1. Volume Delta Analysis
The volume distribution across the two sessions should print a classic “V-shape” or showing absolute expansion on the counter-strike:
- Bar 1: High volume, verifying standard participation in the prevailing trend.
- Bar 2: Equal or significantly higher volume than Bar 1. A high-volume bar with a long real body that completely matches the previous close confirms massive capital commitment behind the defensive wall. Low volume on Bar 2 invalidates the pattern, characterizing it as a low-liquidity anomaly.
2. Microstructural Confluence
A Meeting Lines pattern printing in a structural vacuum features a high statistical failure rate. Its predictive accuracy multiplies when the matching closes occur precisely at:
- A major daily or weekly support/resistance flip line.
- An unmitigated higher-timeframe Order Block or Fair Value Gap (FVG).
- The upper or lower band of a 2.5 Standard Deviation Bollinger Band.
Systematic Execution Strategy
To eliminate emotional bias, execution parameters must be automated based on the closing print of the second candle.
| Execution Parameter | Strategy Specification |
| Trigger Condition | Market order entry at the exact close of Bar 2, provided its closing price matches Bar 1’s close within a maximum 0.05% tolerance threshold. |
| Stop Loss Placement | Bearish Setup: Set strictly 1–2 pips/ticks above the absolute high of Bar 2’s wick. Bullish Setup: Set strictly 1–2 pips/ticks below the absolute low of Bar 2’s wick. |
| Take Profit Targets | Target 1: Placed at the nearest liquid minor swing high/low to secure a 1:1.5 RRR. Target 2: Projected using a 100% Fibonacci retracement of the preceding impulse wave. |
Algorithmic Scanning Logic (C# NinjaTrader 8)
For systematic deployment, the geometric parameters can be translated into production-ready C# code:
C#
// Ensure we have enough bars to check trend context
if (CurrentBar < 20) return;

// 1. Establish Core Pricing Variables
double close1 = Close[1];
double open1  = Open[1];
double close0 = Close[0];
double open0  = Open[0];

// 2. Trend and Geometry Filters (Example: Bearish Top Reversal)
bool isBar1Bullish = close1 > open1;
bool isBar2Bearish = close0 < open0;
bool isGapUpOpen   = open0 > Math.Max(open1, close1);

// Shared Closing Axis Rule (with a 2-tick tolerance)
double closingDifference = Math.Abs(close0 - close1);
bool hasMatchingClose    = closingDifference <= (TickSize * 2);

// Volume Filter
bool hasVolumeConfirmation = Volume[0] >= Volume[1];

if (isBar1Bullish && isBar2Bearish && isGapUpOpen && hasMatchingClose && hasVolumeConfirmation)
{
    // Check if printing at higher-timeframe resistance before firing
    if (Close[0] >= HighTimeframeResistance)
    {
        TriggerShortSignal();
    }
}
By tracking the exact point where a trend extension turns into a matching closing block, systematic traders can bypass lagging indicators and execute alongside institutional liquidity pivots.
Please check our Bearish and Bullish Patterns Indicator collection.