In systematic trend-following, identifying points where an asset pauses to trap counter-trend traders before violently resuming its primary direction is a core alpha driver. While many continuation patterns rely on multi-bar sideways consolidations, the Separating Lines pattern is a sharp, two-bar continuation structure that signals immediate trend validation.
It maps a session where the market attempts an aggressive counter-trend opening, only for institutional buyers to instantly absorb the supply and push the market right back into acceleration.
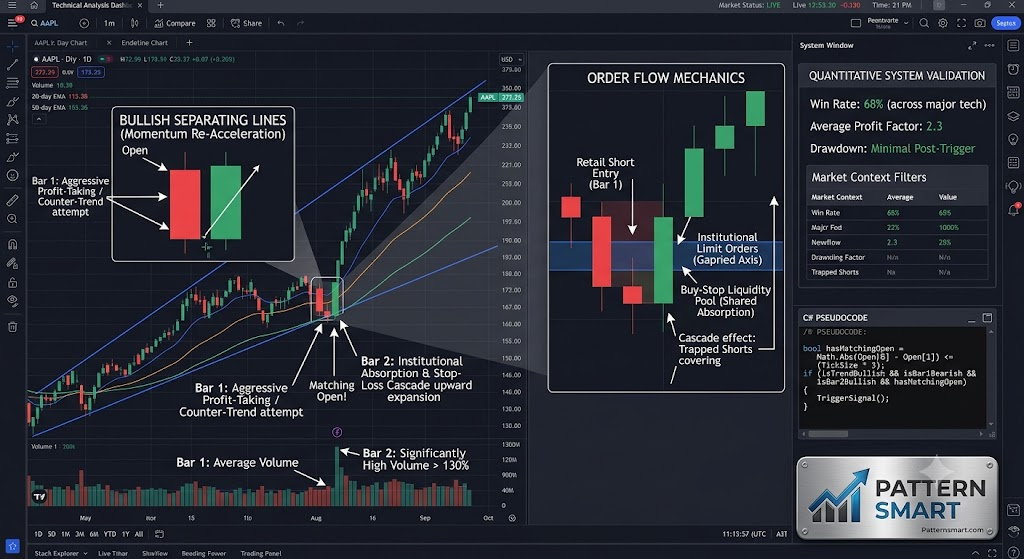
Anatomy of the Separating Lines Pattern
The Separating Lines pattern occurs exclusively within an established trend. While it can appear in both bullish and bearish contexts, the Bullish Separating Lines structure is a highly reliable indicator of sustained buying pressure.
To validate this pattern for algorithmic or discretionary execution, the two-bar sequence must satisfy three strict geometric conditions:
- The Prevailing Trend: The market must be in a clearly defined, higher-timeframe uptrend.
- Bar 1 (The Counter-Trend Cut): Bar 1 prints as a strong, expanding bearish (red) candle. This session represents an abrupt wave of profit-taking or an aggressive attempt by short-sellers to reverse the market architecture.
- Bar 2 (The Momentum Mirror): Bar 2 opens with a sharp, dramatic gap upward. Crucially, its opening price must be exactly equal to (or within a minor tick of) the opening price of Bar 1. From that open, the price surges throughout the session, closing as a long bullish (green) candle.
The structural signature of this pattern is the shared opening axis between two opposing, expanding candles.
Underlying Market Mechanics and Order Flow
Evaluating the pattern purely on a visual basis misses the institutional tug-of-war taking place inside the order book:
- The Bear Trap: Bar 1 creates a deceptive sense of trend exhaustion. Retail traders and short-term momentum systems see the large red candle and enter fresh short positions, placing their stop-loss orders just above the opening print of Bar 1.
- The Value Gap: Before the next session begins, institutional blocks or significant market makers re-evaluate value, recognizing the discount. The market opens with an aggressive gap up to match Bar 1’s starting point.
- The Stop-Loss Cascade: Because Bar 2 opens right at the exact origin of Bar 1’s bearish drive, every single short trader who entered during the previous session is instantly put under stress. As Bar 2 begins to trade higher, it immediately triggers the cluster of buy-stop liquidity sitting just above that shared opening axis.
- The Velocity Surge: The simultaneous combination of trapped shorts buying to cover and fresh trend-followers entering long market orders creates an order vacuum, driving the aggressive expansion seen in Bar 2’s body.
Technical Validation and Filters
Because a two-bar pattern lacks long-term structural development, systematic traders deploy secondary filters to eliminate false signals in choppy or illiquid regimes.
1. Volume Delta Confirmation
The volume profile should exhibit a distinct expansion on the second bar:
- Bar 1: Average to slightly above-average volume (standard liquidating pressure).
- Bar 2: Significantly higher volume than Bar 1 (ideally $> 130\%$). This volume expansion confirms that institutional capital actively backed the gap up and aggressively drove the price higher, rather than it being a low-liquidity anomaly.
2. Relative Structural Location
The Separating Lines pattern gains statistical weight when it prints relative to key structural support. If Bar 1 sells off precisely into a rising 20-period Exponential Moving Average (EMA) or a prior broken resistance-turned-support flip zone, Bar 2 represents a successful, dynamic defense of that structural level.
Systematic Execution Strategy
To eliminate emotional bias, execution parameters must be completely rule-based upon the closing print of the second candle.
| Execution Parameter | Strategy Specification |
| Trigger Condition | Market entry at the exact close of Bar 2, provided its opening price matched Bar 1’s open within a maximum 5% tolerance of the total bar range. |
| Stop Loss Placement | Set strictly 1–2 pips/ticks below the low of Bar 1. If the market retraces deep enough to clear the low of the initial bearish attempt, the trend continuation thesis is structurally invalidated. |
| Take Profit Targets | Target 1: Placed at a 1:1.5 Risk-to-Reward Ratio (RRR) based on the physical stop distance. Target 2: Projected using a 100% Fibonacci extension of the combined Bar 1 & Bar 2 structural height. |
Algorithmic Scanning Logic (Pseudocode Reference)
For traders looking to code this structure into platforms like NinjaTrader 8 (C#) or custom Python scanning backtesters, the mathematical rule-engine is straightforward:
C#
// Define Bars
bool isBar1Bearish = Close[1] < Open[1];
bool isBar2Bullish = Close[0] > Open[0];

// Shared Opening Axis Rule (with a tiny tick tolerance)
double openDifference = Math.Abs(Open[0] - Open[1]);
bool hasMatchingOpen = openDifference <= (TickSize * 2);

// Size Rule (Ensure both bars represent real expansion, not noise)
bool isSignificantExpansion = (High[0] - Low[0] > ATR(14)[0]) && (High[1] - Low[1] > ATR(14)[1]);

if (isTrendBullish && isBar1Bearish && isBar2Bullish && hasMatchingOpen && isSignificantExpansion)
{
    TriggerLongSignal();
}
The Separating Lines pattern remains a premier weapon for trend-following systems, perfectly illustrating how institutional liquidity can weaponize short-term counter-trend momentum to fuel macro trend expansion.
Please check our Bearish and Bullish Patterns Indicator collection.