Price Range indicator for Thinkorswim TOS.
Price Range indicator for Thinkorswim.
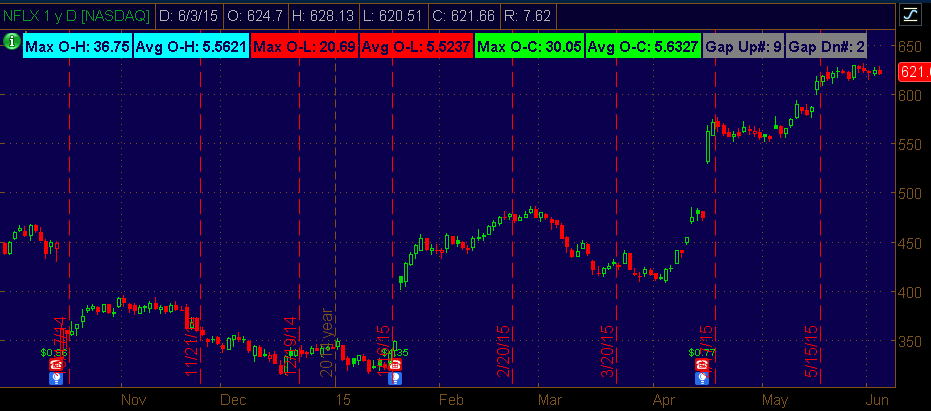
This indicator simply shows how price changes within a given range.
Features:
- Max O-H: the maximum value of the difference between Open and High in 1 bar.
- Max O-L: the maximum value of the difference between Open and Low in 1 bar.
- Max O-C: the maximum value of the difference between Open and Close in 1 bar.
- Avg O-H: the average value of the difference between Open and High in the given range.
- Avg O-L: the average value of the difference between Open and Low in the given range.
- Avg O-C: the average value of the difference between Open and Close in the given range.
- Gap Up#: the number of upward gaps in the given range.
- Gap Dn#: the number of downward gaps in the given range.
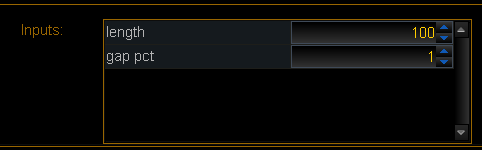
Settings:
Length: number of bars used to calculate the price range.
Gap pct: the percentage in price change of the gap.
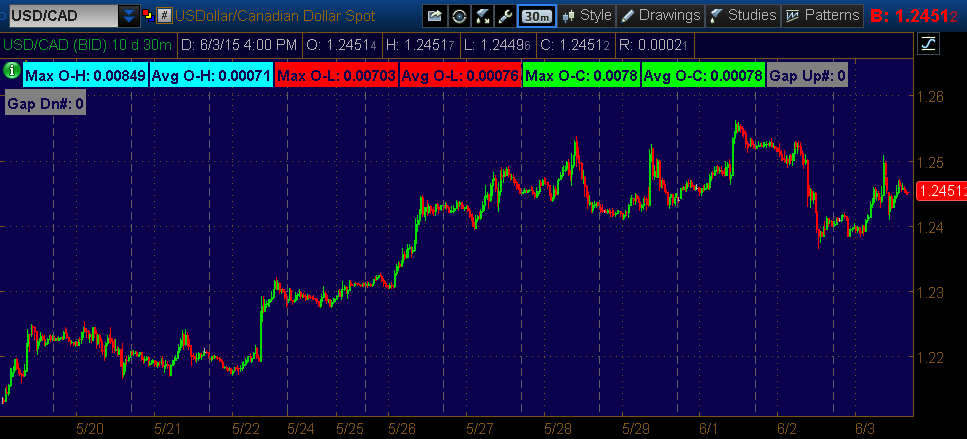
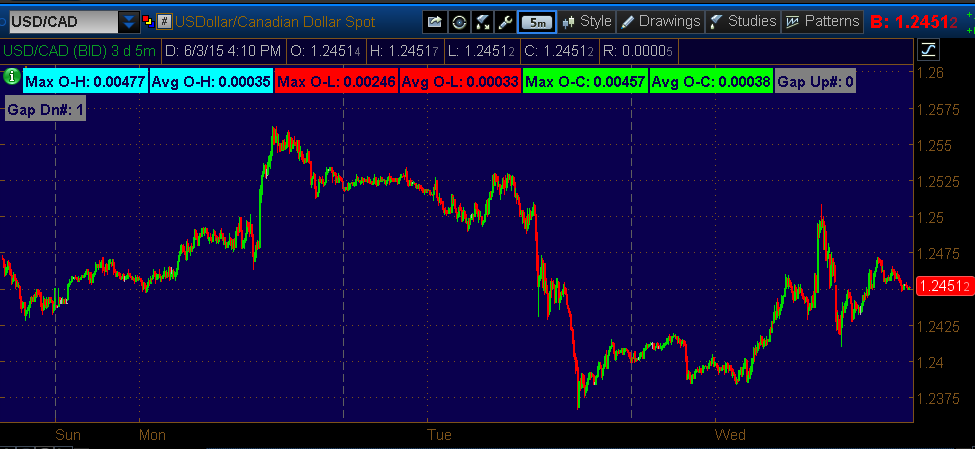
This indicator works in all time periods.
Example:
If you set length=50, gap pct=1.0 on a Daily chart.
This indicator will find the price range (such as Max O-H, gaps) in 50 trading days.
If you set length=50, gap pct=1.0 on a 15min chart.
This indicator will find the price range (such as Max O-H, gaps) in 50 15min bars.


If you want to add any feature to this indicator, please send us a Customization request.
This is a free item for VIP member only.
Regular member can get this for free by taking a quick survey.