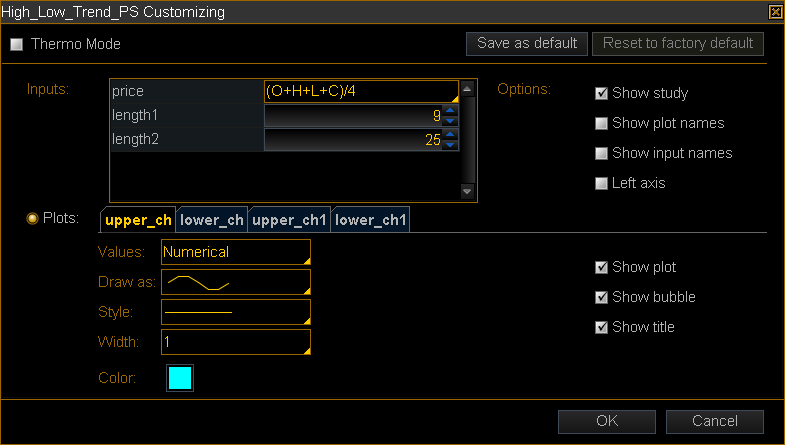
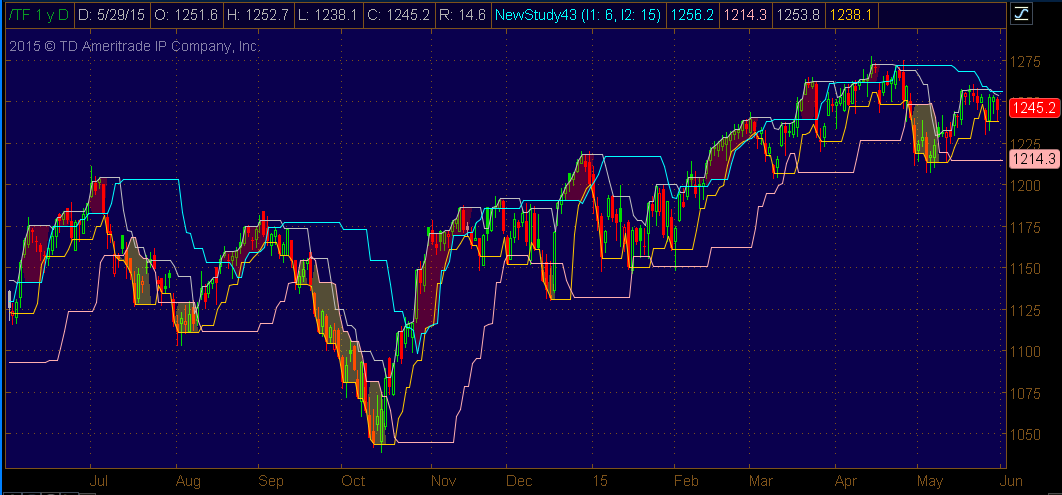
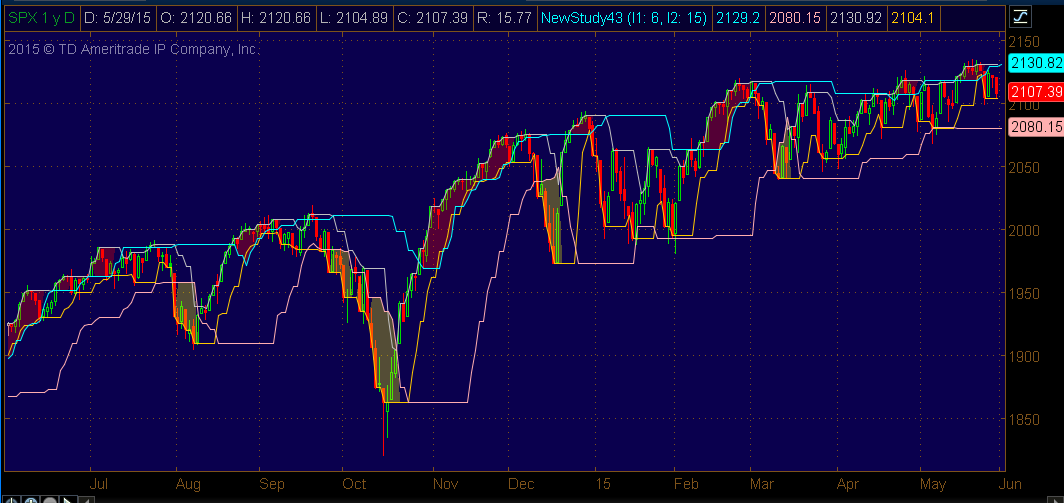
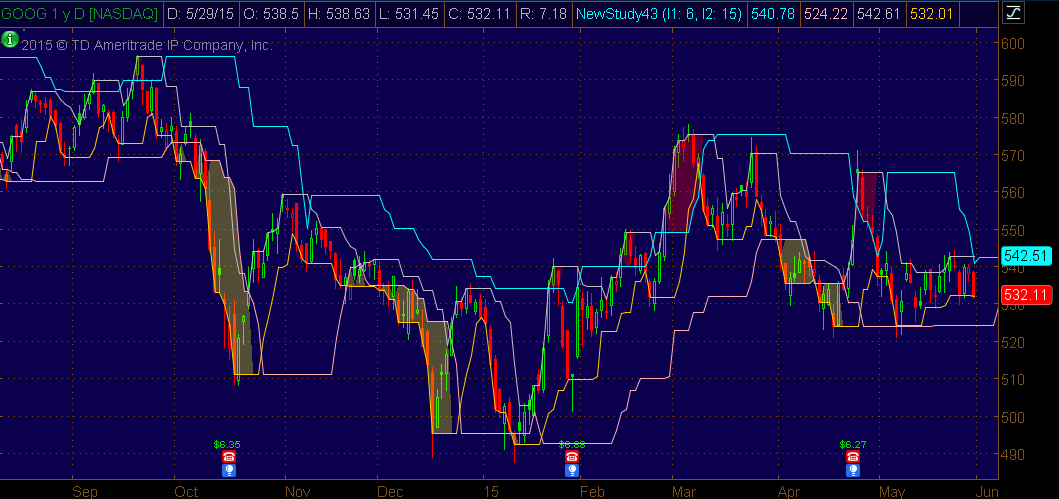
High Low Range indicator for Thinkorswim (TOS)
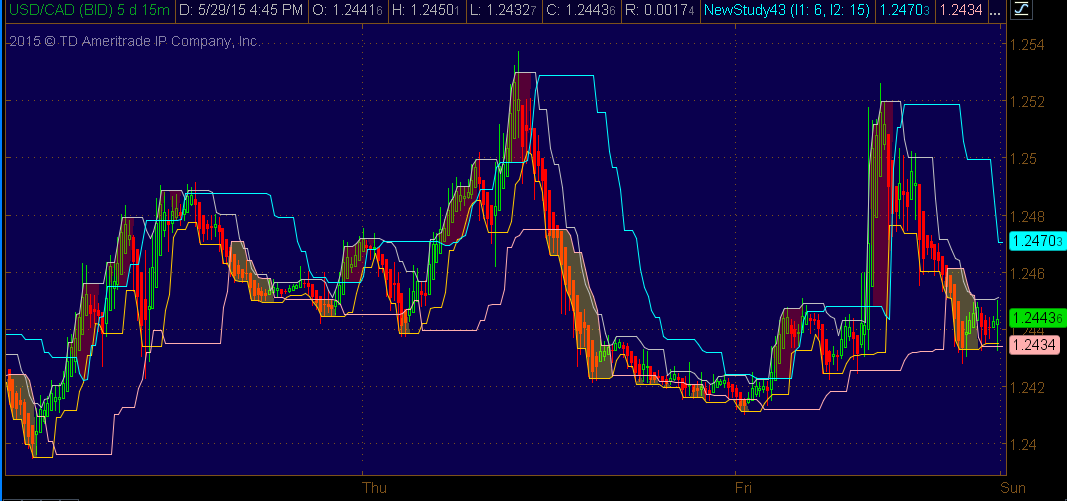
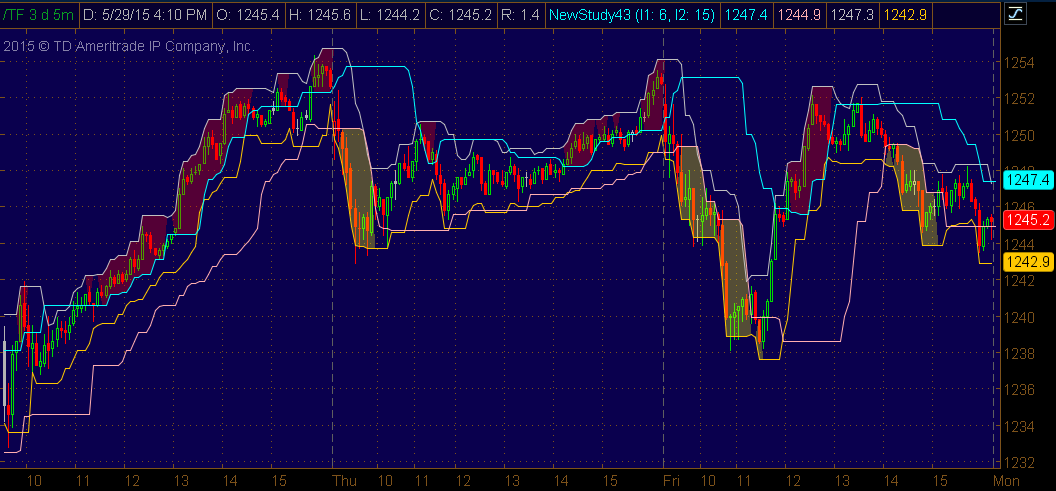
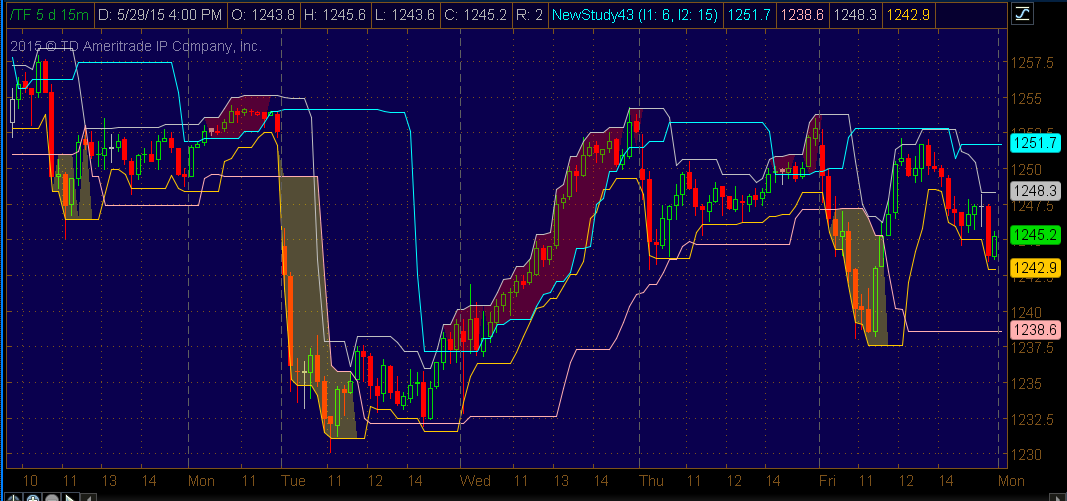
This indicator plots 4 lines derived by the highest and lowest values within a given range.
A highlight area shows a price range and possible reversal trends.
Features:
- Price input: can be open, close, high, low, hl2, hlc3, ohlc4, volume.
- Lenght1: number of bars used to calculate the highest and lowest values of Price input.
- Lenght2: same as lenght1, we can use length1 as short term and length2 as long term.
- Highlight area: price range and possible reversal trends.
It works in any time period(Tick, Minutes, Daily, Weekly, Monthly) and for all markets(Stocks, Futures, Forex, Options,ETF, etc.)