MetaTrader 4 indicator
Rectangle Chart Pattern indicator for MT4
Spot trading-range rectangles the moment they form. The indicator scans your MetaTrader 4 chart, draws flat upper and lower boundaries, projects them forward and alerts you when price breaks out, so you stop measuring ranges by eye.
- MetaTrader 4
- Any symbol
- Any timeframe
- Found and breakout alerts
The pattern
What is a rectangle chart pattern?
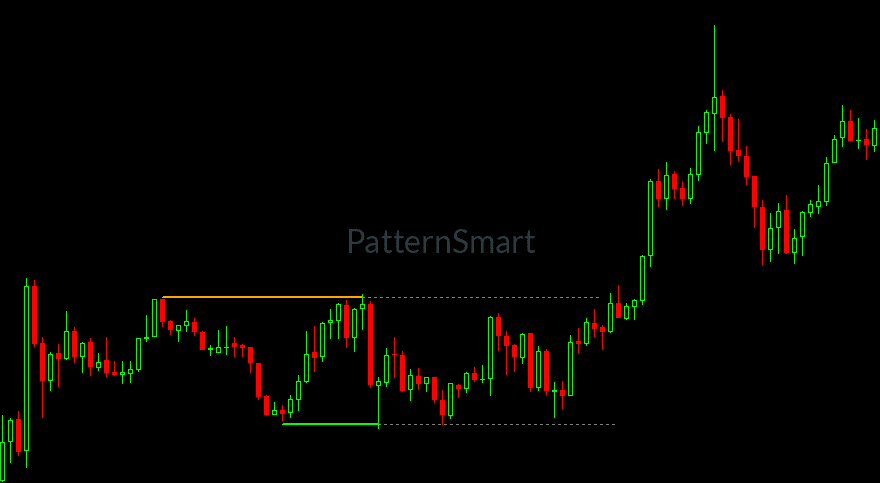
A rectangle, also called a trading range, consolidation box or horizontal channel, forms when price moves sideways between a flat ceiling and a flat floor. Price tests resistance, falls back, tests support, and repeats. Unlike triangles and wedges, the two boundaries do not converge. They run parallel and level.
The box shows a market where buyers and sellers are in balance. Traders watch it for the moment price leaves the range, upward or downward, and use the top and bottom edges as reference levels for entries, stops and targets.
Rectangles are easy to see after the fact and hard to draw consistently while they form. You have to judge how level the edges are, notice the pattern early and then keep watching for a breakout. The Rectangle Chart Pattern indicator for MT4 does that scanning on every bar, so you can spend your time on the trade instead of the horizontal lines.
Why MT4
A rectangle chart pattern indicator built natively for MetaTrader 4
This version is written for the MT4 terminal and works the way MT4 traders expect: compiled file, native chart objects, platform alerts and standard inputs.
Ready-to-run .ex4 file
You receive a compiled MT4 indicator. Copy it into the Indicators folder, refresh the Navigator and attach it. There is nothing to compile and no DLL or outside software to install.
Standard MT4 chart objects
Boundaries and projections are drawn as regular MT4 trend lines, so you can see, select and inspect them with the tools you already use. They are cleared from the chart when you remove the indicator.
Clean chart-window overlay
The indicator draws directly on the price chart and adds no extra sub-window, leaving room for the oscillators and tools already on your screen.
Native MT4 alerts
Found and breakout events use the Alert window, a sound file from your Sounds folder and the Experts log, with a separate sound for each event so you know which one fired.
Every broker, symbol and timeframe
It follows whatever your MetaTrader 4 terminal offers, from M1 to monthly, so you can scan forex, metals, indices and CFDs from the same setup.
Templates and EA access
Inputs live in the standard MT4 properties window, so your setup can be saved in a chart template. The breakout buffer can be read from your own tools with iCustom.
Features
Everything you need to trade rectangle breakouts on MT4
A chart-window indicator built for one job: finding rectangles quickly, drawing them clearly and telling you when price leaves the box.
Automatic rectangle detection
Scans the visible history and every new bar for rectangles. No manual horizontal lines, no guessing which touches belong to the box.
Small, medium and large sizes
Look for compact ranges, mid-sized ones or wide structures. Switch each size on or off to match the scale you trade.
Adjustable flatness
One input controls how level the upper and lower boundaries must be. Choose stricter, cleaner boxes or allow looser ones.
Boundaries and forward projection
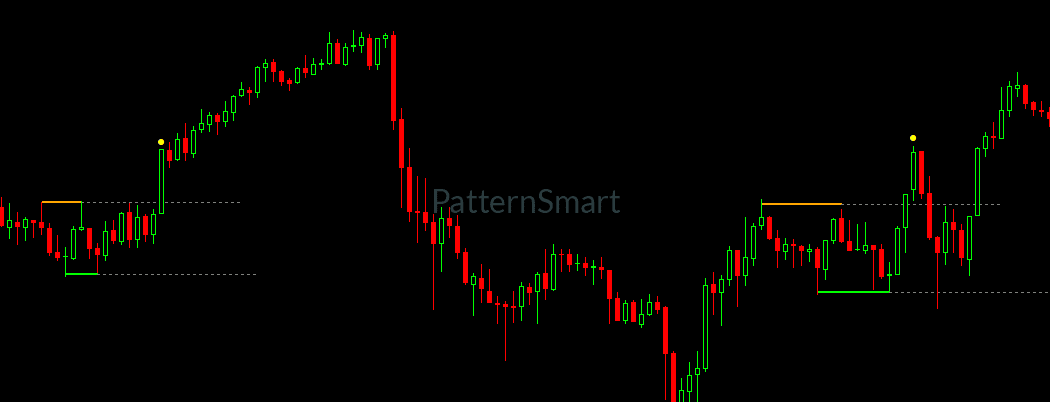
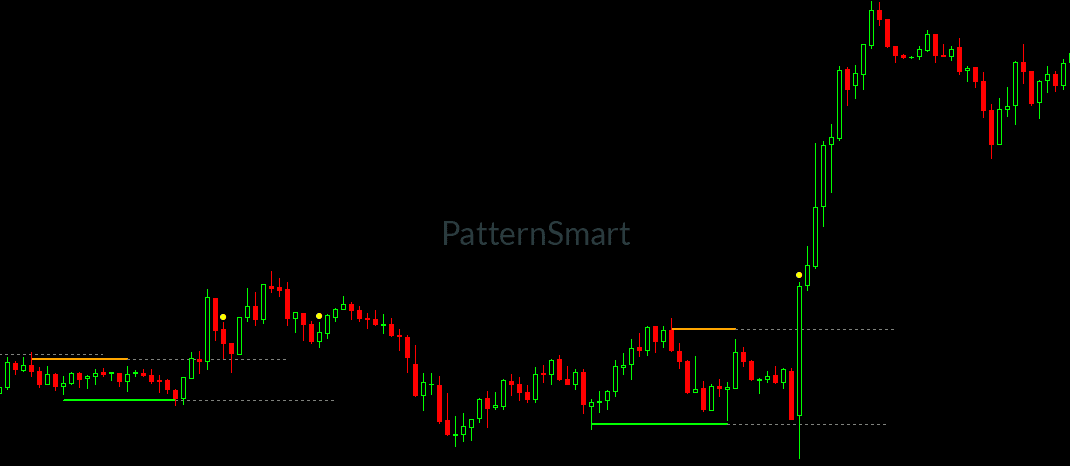
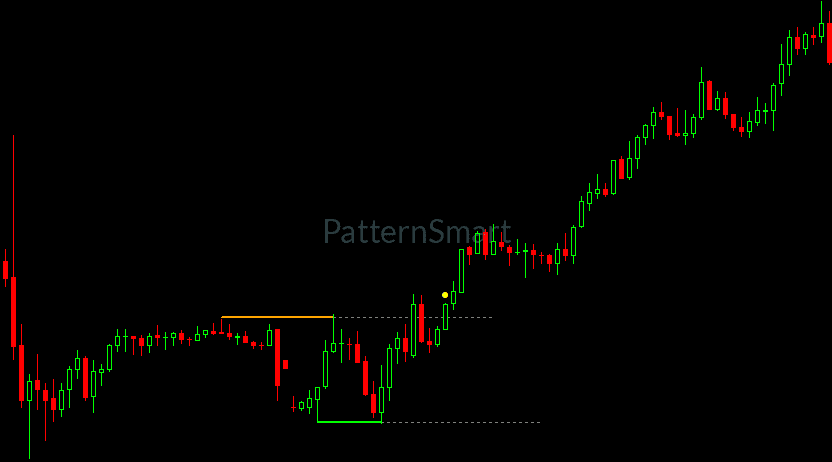
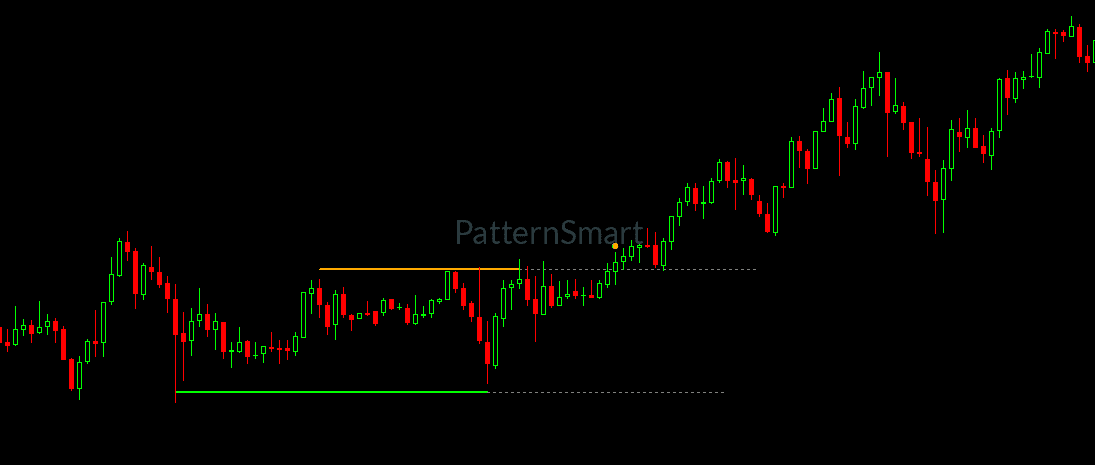
Solid orange and lime lines mark the box. Dotted lines run ahead so you can see the levels price is about to test. Set how many bars they extend.
Found and breakout alerts
Get notified when a new rectangle appears and again when a breakout is marked, each with its own sound file, a pop-up and a log message.
Bullish and bearish breakout dots
A yellow dot above the bar flags a close over the upper boundary. A dot below the bar flags a close under the lower boundary.
Latest-pattern-only mode
Keep only the most recent rectangle on the chart. Older lines are removed automatically, which keeps busy charts readable.
Full control of line style
Choose separate colors for the upper boundary, lower boundary and projection lines, and set the line width to match your chart theme.
Pattern sizes
Choose the rectangle size that fits your trading
Rectangles come in different scales. Pick the sizes you care about and leave the rest off.
Small
Compact ranges
Short consolidations that form over a handful of bars. Suited to lower timeframes and fast intraday trading.
Medium
Everyday ranges
Mid-sized boxes that fit most day trading and short swing setups. A balanced choice for general use.
Large
Wide ranges
Big, slow-forming boxes with a tall price range. Useful on higher timeframes for swing and position traders.
All three sizes are on by default. Turn off the ones you do not trade and the chart stays cleaner.
Setup
Install the Rectangle Chart Pattern indicator for MT4 in minutes
-
Copy the file into MetaTrader 4
In MT4, choose File, then Open Data Folder. Place
ChartPatternRectangle.ex4inMQL4/Indicators. Restart MT4, or right-click the Navigator and choose Refresh. -
Attach it to a chart
Open any symbol and timeframe, find the indicator under Navigator, Indicators, and drag it onto the chart.
-
Pick your sizes and flatness
In the inputs window, enable the pattern sizes you want, adjust the horizontal tolerance, set the projection length and choose colors and sounds. The defaults work well out of the box.
-
Let the chart do the scanning
Rectangles appear with their boundaries and projections. Keep alerts on and MT4 will notify you when a new one forms and when a breakout is marked.
Requires MetaTrader 4 build 600 or newer and some price history loaded on the chart. The default alert sounds, alert.wav and alert2.wav, ship with MT4.
In practice
How traders use rectangle patterns
Ranges often end in a breakout, but false breakouts happen too. Many traders wait for confirmation and size positions with that risk in mind. The indicator finds the pattern. Your plan decides what to do with it.
Breakout watching
Use the boundaries as reference levels and let the breakout dot draw your eye when price leaves the box. Wait for your own confirmation before acting.
Range trading context
Rectangles show exactly where price has been rejected on both sides. Combine the box edges with the support and resistance levels you already trade.
Compression awareness
A tight, flat range is a pause in the market. Use it to prepare stop distances, position size and alerts before the next move.
Multi-timeframe confirmation
Run the Large size on a higher timeframe for the bigger picture and the Small size on a lower one to time entries around the box.
Settings
Inputs you can adjust
Every option appears in the standard MT4 inputs window when you attach the indicator.
| Input | Default | What it does |
|---|---|---|
EnableSmall |
true | Look for small rectangle patterns. |
EnableMedium |
true | Look for medium-sized rectangles. |
EnableLarge |
true | Look for large rectangles. |
HorizontalToleranceATR |
0.75 | How level the upper and lower boundaries must be. Lower values accept only flatter rectangles, higher values accept looser ones. |
LastOnly |
false | Show only the most recent rectangle and remove older ones. |
SetAlert |
true | Play sounds, open the Alert window and write to the Experts log when a rectangle is found or a breakout appears on the live bar. |
ExtensionBars |
20 | How many bars the dotted projection lines run ahead. This is also how long breakouts are watched after a rectangle appears, so 0 hides the projections and turns breakout markers off. |
LineWidth |
2 | Thickness of the boundary lines and the breakout dot. |
UpperLineColor |
Orange | Color of the upper boundary line. |
LowerLineColor |
Lime | Color of the lower boundary line. |
ExtensionLineColor |
Gray | Color of the dotted projection lines. |
SoundAlertFile |
alert.wav | Sound played when a rectangle is found. Use any file in your MT4 Sounds folder. |
BreakoutSoundAlertFile |
alert2.wav | Sound played when a breakout is marked. |
Compatibility
Requirements and compatibility
- Platform
- MetaTrader 4, build 600 or newer
- File format
- Compiled .ex4 indicator
- Indicator type
- Chart window overlay
- Symbols
- Any instrument your broker offers
- Timeframes
- M1 to MN
- Alerts
- Sound file, Alert window and Experts log
- Data buffer
- One breakout buffer for iCustom
- Trading
- Analysis only, places no orders
FAQ
Rectangle Chart Pattern indicator for MT4: frequently asked questions
What does a rectangle chart pattern indicator do?
It scans price for rectangle patterns, also known as trading ranges, where price keeps bouncing between a flat ceiling and a flat floor. When it finds one, it draws the upper and lower boundaries on your MT4 chart, projects them forward, marks breakouts and can alert you.
Does it work on every symbol and timeframe?
Yes. It runs on any symbol your broker offers in MetaTrader 4, from forex pairs to metals, indices and crypto CFDs, and on every timeframe from M1 to monthly.
What is the difference between small, medium and large patterns?
The three sizes look for rectangles of different scales. Small suits quick intraday ranges, medium suits everyday trading, and large picks up wide, slow-forming ranges on higher timeframes. You can enable any combination.
How do the alerts work?
With alerts enabled, the indicator notifies you twice in a rectangle’s life: when a new rectangle is found and when a breakout is marked on the live bar. Each event plays its own sound file, opens the MT4 Alert window and writes a message to the Experts log. The defaults are alert.wav and alert2.wav, and you can use any file in your MT4 Sounds folder.
How are breakouts shown?
After a rectangle appears, a yellow dot is placed above the bar when price closes above the upper boundary, or below the bar when price closes below the lower boundary. Breakouts are watched while the dotted projection lines are running, so the number of projection bars also sets how long a rectangle is monitored.
Does it place trades for me?
No. It is an analysis tool that marks patterns on your chart. It does not open, modify or close orders, so every trading decision stays with you.
Can the signal change while a bar is still forming?
Yes. The indicator evaluates every bar, including the one still forming, so a rectangle or breakout flagged on the live bar can change before that bar closes. Many traders wait for the bar to close before acting on it.
Can I read the breakout from an Expert Advisor?
The indicator exposes one visible data buffer that holds a value on bars where a breakout is marked. You can read it from your own tools with iCustom. You receive the compiled .ex4 file, which attaches and runs like any other MT4 indicator.
Does a rectangle pattern guarantee a profitable trade?
No chart pattern does. Ranges can end in false breakouts, and price can reverse after leaving a box. Use the indicator alongside your own analysis, confirmation and risk management.
Get started
Add the Rectangle Chart Pattern indicator to your MT4 charts
Stop drawing range boxes by hand. Attach the indicator, choose your pattern sizes and let MetaTrader 4 tell you when a rectangle forms and when price breaks out.
Trading leveraged products such as forex and CFDs carries a high level of risk and may not be suitable for everyone. You can lose more than your initial deposit.
The Rectangle Chart Pattern indicator for MT4 is a charting tool for MetaTrader 4. It is not financial advice and does not guarantee results. Past patterns do not predict future price movement. MetaTrader is a trademark of its respective owner.