In technical analysis, rare structural patterns offer some of the most reliable trade setups because they signify distinct shifts in market psychology. One such rare, highly specific formation is the Stick Sandwich.
Named for its visual resemblance to a sandwich on a chart, this three-bar pattern reveals a fierce tug-of-war between buyers and sellers where an existing trend encounters a hard, unyielding support or resistance level.
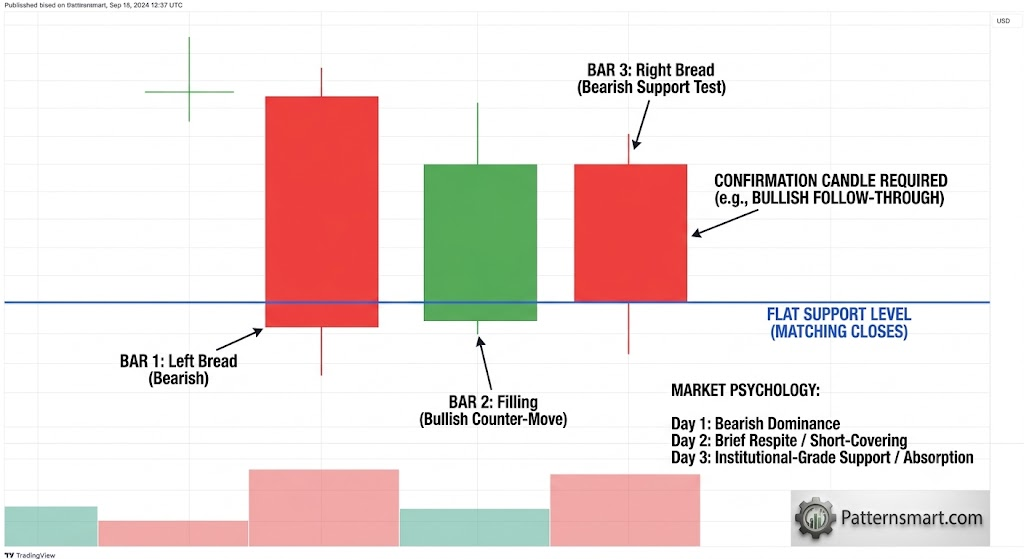
Anatomy of the Stick Sandwich
The Stick Sandwich occurs in both bullish (reversal) and bearish (continuation or reversal) variants, though the classic Bullish Stick Sandwich at the bottom of a markdown is the most widely recognized and traded by technical analysts.
The Bullish Stick Sandwich (Bullish Reversal)
To qualify as a valid Bullish Stick Sandwich, the price action must develop within a defined downtrend and meet three strict criteria:
- Bar 1 (The Left Bread): A large, bearish (red/black) candle that continues the prevailing downtrend, closing near its lows.
- Bar 2 (The Filling): A bullish (green/white) candle that gaps or opens higher than Bar 1’s close. It must trade upward, closing entirely above the close of the first candle.
- Bar 3 (The Right Bread): A second large, bearish candle that engulfs the middle bar and drives down to close at virtually the exact same level as Bar 1’s close.
Critical Rule: The foundational validity of this pattern rests on the matching closing prices of Bar 1 and Bar 3. This equal-low structure creates a robust, immediate horizontal support line.
The Bearish Stick Sandwich (Bearish Continuation/Reversal)
The inverse structure occurs during an uptrend:
- Bar 1: A strong bullish candle extending the upward move.
- Bar 2: A bearish candle that opens lower and closes below Bar 1’s open.
- Bar 3: A second strong bullish candle that rallies to close at the exact same level as Bar 1’s close, forming a flat overhead resistance ceiling.
Market Psychology: Behind the Structural Wall
Understanding why this pattern works requires breaking down the order flow and trader psychology across the three days:
- Day 1: Dominance. Sellers are fully in control, driving prices down aggressively to print a solid bearish body. Sentiment is highly pessimistic.
- Day 2: Overconfidence & Counter-Response. The next session starts with a brief respite or short-covering rally. Buyers step in, pushing the price higher to close above Day 1’s close. Shorts become uneasy, while aggressive bulls view this as the potential bottom.
- Day 3: The Trap & The Brick Wall. Bearish traders return with force, eager to wipe out Day 2’s progress. They push the price all the way back down, completely engulfing the middle day’s gains. However, when they reach the exact closing price of Day 1, selling pressure completely dries up.
Despite a massive bearish effort on Day 3, the bears fail to establish a new low. This structural failure reveals that institutional-grade limit orders are sitting at that exact price floor. Sellers realize they have run into a brick wall, sets the stage for a short-squeeze reversal.
Quantitative & Algorithmic Implementation
Because this pattern relies on exact mathematical relationships (specifically matching closes), it is highly suited for algorithmic scanning and automated trading systems (such as NinjaTrader, Pine Script, or custom C# environments).
When writing scanning logic, using a strict equality operator for Close[0] == Close[2] can result in too few matches on live data due to decimal noise. Quantitative models typically introduce a tiny volatility-normalized tolerance or threshold variable, $T$:
$$\Delta = |Close_{Bar 1} – Close_{Bar 3}|$$
$$T = ATR(14) \times 0.05$$
The pattern triggers a valid signal only when $\Delta \le T$, ensuring the closing prices are structurally identical relative to current market volatility.
Strategic Trading Blueprint
A Stick Sandwich should never be traded blindly upon the close of Bar 3. Because it represents a potential support floor, confirmation is mandatory.
                  [Bullish Entry Trigger] -> Breaks Bar 2 High
                       |
     | |               |
     | |     | |       |
     | |     | |      [#]  <- Confirmation Candle (Green)
     | |     | |       |
-----\ /-----\ /------------------------ [Flat Support Line]
    Bar 1   Bar 2    Bar 3
                       |
                [Stop Loss Placement] -> Just Below Lows
1. The Entry Execution
- Wait for Bar 4 (Confirmation): Do not enter on the close of Bar 3. Wait for the next candle to open.
- Trigger: The conservative entry is a buy-stop order placed just above the high of Bar 2 (the middle filling). A more aggressive entry triggers if Bar 4 breaks above the high of Bar 3, confirming that the support floor held and buyers are actively lifting offers.
2. Risk Management (Stop Loss)
- Place the stop loss just below the matching lows of Bar 1 and Bar 3.
- Because these two points establish a clear structural floor, any breach below this level invalidates the entire pattern’s thesis, making a tight, well-defined exit easy to enforce.
3. Profit Targets
- Measure the height of the entire sandwich pattern (from the highest peak of the three bars to the flat support line).
- Project that distance upward from your entry point to establish a Minimum Take-Profit (TP1) target, aiming for an initial 1:1.5 or 1:2 risk-to-reward ratio.
Performance Notes & Best Practices
To maximize the edge when trading this pattern, keep these strategic considerations in mind:
- Volume Confirmation: Look for declining volume on Bar 3 compared to Bar 1. If Bar 3 prints on exceptionally high volume but still fails to close lower than Bar 1, it demonstrates intense absorption by institutional buyers.
- Context over Structure: A Bullish Stick Sandwich carrying a reversal thesis carries significantly more weight if it prints at an established higher-timeframe support zone, near a major moving average (like the 200-day EMA), or when daily momentum oscillators (RSI, Stochastics) are deeply oversold.
- Timeframe Selection: While visible on intraday charts, the pattern is most reliable on Daily and Weekly intervals, where closing prices reflect institutional settlement choices rather than short-term algorithmic noise.
Please check our Bullish Patterns Indicator collection.