The Three Inside Up is a highly reliable, three-candle bullish reversal pattern that marks a sharp, decisive shift in market structure. While single-candle formations like the Harami flag a potential pause in a markdown phase, the Three Inside Up provides the systematic validation required to confirm that institutional accumulation has begun and that a structural bottom is firmly in place.
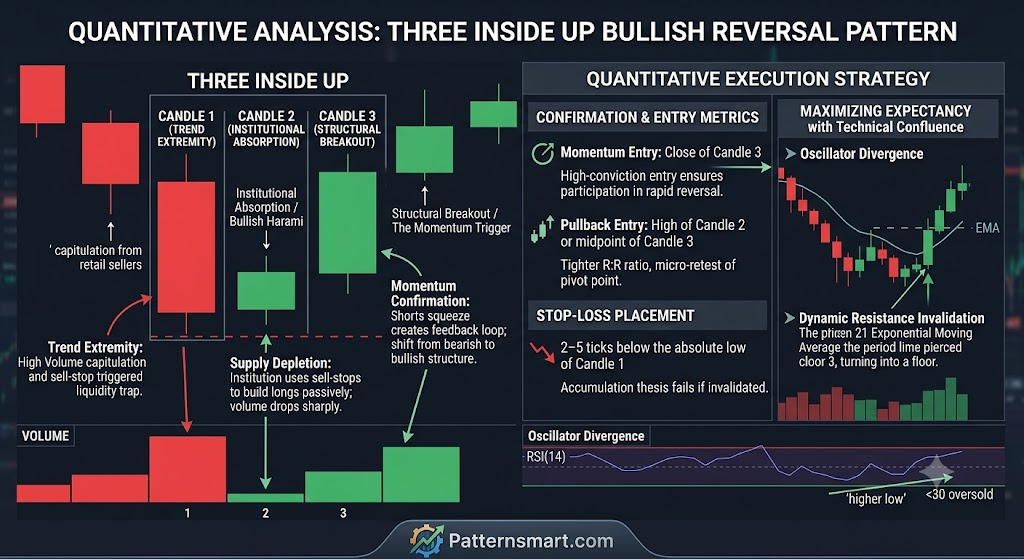
Anatomy of the Pattern
The pattern developments unfold at the tail end of a mature downtrend and must adhere to strict structural criteria across three consecutive sessions:
- Candle 1 (The Trend Extremity): A large bearish candle that continues the prevailing markdown phase. This represents strong, high-volume capitulation from retail sellers.
- Candle 2 (The Institutional Absorption): A small bullish candle that prints entirely within the real body of Candle 1. Crucially, its real body must be completely contained by the real body of the first candle (forming a classic Bullish Harami). This signifies that the downward momentum has abruptly stalled as larger market participants begin absorbing supply.
- Candle 3 (The Structural Breakout): A solid bullish candle that closes completely above the high of Candle 2, and ideally above the midpoint or open of Candle 1. This session provides the ultimate quantitative validation, proving that the shift in demand has structural follow-through.
Market Psychology & Order Flow Dynamics
Analyzing the underlying auction mechanics reveals a classic liquidity trap and subsequent trend reversal:
- Aggressive Liquidation (Candle 1): The bears maintain absolute control, pressing prices to new local lows. This aggressive move triggers sell-stops, creating a deep pocket of sell-side liquidity.
- Supply Depletion & Passive Buying (Candle 2): Instead of continuing the downward trajectory, the market opens inside the previous day’s range. Institutional algorithms exploit the sell-side liquidity to build long positions passively. Because they are absorbing supply rather than chasing price, the candle remains small, but the green close indicates that sellers are no longer able to drive the auction lower.
- The Short Squeeze & Momentum Trigger (Candle 3): As the price breaks above the high of the second candle, early momentum shorts are forced to cover out of necessity. This buying feedback loop, paired with new long-side participants stepping into the market, creates an immediate supply/demand imbalance that shifts the short-term market structure from bearish to bullish.
Quantitative Execution Strategy
Because the Three Inside Up relies on structural confirmation on the third session, systematic traders can deploy precise execution rules to maximize expectancy.
Confirmation and Entry Metrics
| Component | Tactical Action | Notes |
| Momentum Entry | Market order executed immediately upon the close of Candle 3. | High-conviction entry that ensures participation in a rapidly accelerating reversal. |
| Pullback Entry | Limit order placed at the high of Candle 2 or the midpoint of Candle 3. | Captures a micro-retest of the structural pivot point, offering a tighter risk-to-reward ratio. |
| Stop-Loss Placement | Placed 2–5 ticks below the absolute low of Candle 1. | If the market invalidates the low of the initial capitulation candle, the accumulation thesis fails completely. |
Maximizing Expectancy with Technical Confluence
- Volume Decrescendo to Expansion: The volume profile should ideally show high relative volume on Candle 1 (selling climax), a sharp drop in volume on Candle 2 (supply drying up), and a distinct expansion of buy volume on Candle 3 (momentum confirmation).
- Oscillator Divergence: The pattern yields its highest win rates when it forms in tandem with a 14-period Relative Strength Index (RSI) or Williams %R emerging from oversold territory ($<30$ or $<-80$). Look for a higher low to print on the oscillator across the three-candle structure while price sets its local floor.
- Dynamic Resistance Invalidation: The validity of this reversal increases dramatically if the close of Candle 3 forces a clean breakout above a descending short-term moving average, such as the 9-period or 21-period Exponential Moving Average (EMA), turning an old dynamic ceiling into a new structural floor.
Please check our Bullish Patterns Indicator collection.