In the pursuit of trading mastery, many investors embark on a quest for the “Holy Grail”—a single technical indicator or algorithmic system that can accurately predict price movement regardless of the environment. However, experienced market participants eventually realize a fundamental truth: No indicator works in all market conditions.
Technical indicators are mathematical transformations of price and volume. Because they are based on specific formulas, they are inherently specialized. A tool designed to capture a trend will naturally struggle in a sideways market, and a tool designed for range-bound volatility will fail during a breakout.
Here is a deep dive into why indicators are environmentally dependent and how to adapt your strategy to the ever-shifting market landscape.
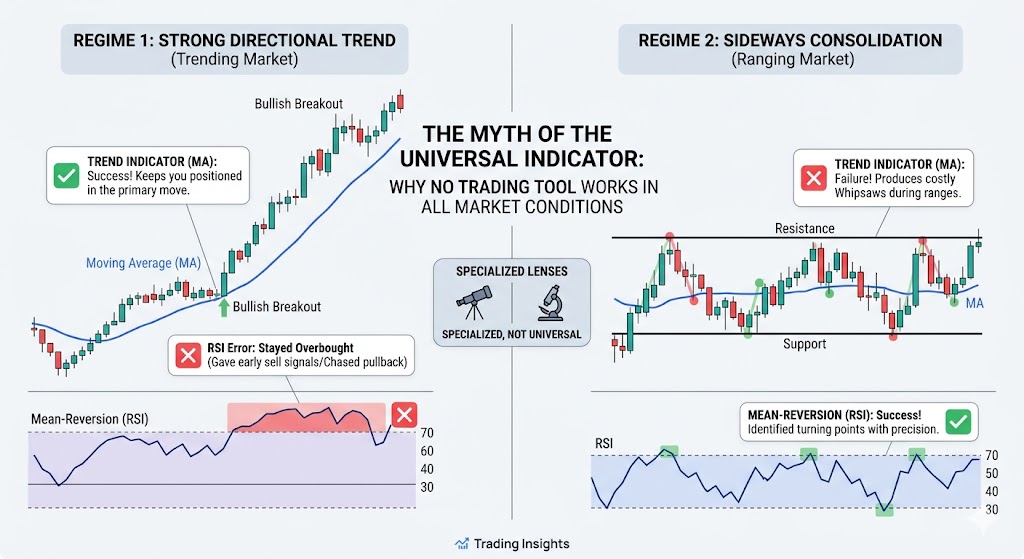
1. The Trend vs. Mean-Reversion Conflict
Market behavior can generally be categorized into two primary states: Trending (directional movement) and Ranging (sideways consolidation).
- Trend Indicators (e.g., Moving Averages, MACD, Parabolic SAR): These are designed to keep you in a move as long as momentum persists. In a strong trend, they are invaluable. However, during a ranging market, these indicators produce “whipsaws”—repeated buy and sell signals that occur just as the price hits the top or bottom of a narrow range, leading to a series of small, frustrating losses.
- Mean-Reversion Indicators (e.g., RSI, Stochastics, Bollinger Bands): These identify “overbought” and “oversold” conditions. They excel in ranging markets by picking turning points. However, in a strong trend, these indicators can stay in overbought or oversold territory for weeks. A trader shorting a stock simply because the RSI is above 70 during a powerful breakout will often find themselves positioned against a “runaway” trend.
2. The Volatility Gap
Indicators often have “look-back” periods (e.g., a 14-day RSI or a 50-day SMA). These periods assume a certain level of market velocity.
When market volatility shifts—such as during a sudden economic announcement or a black swan event—the historical data used by the indicator becomes less relevant to the current “fast” market. An indicator that was perfectly tuned for a low-volatility summer might become completely erratic during a high-volatility autumn.
3. Change in Market Microstructure
Markets are not static; they are an evolving collective of human psychology and algorithmic logic.
- Liquidity Shifts: Indicators may react differently in a highly liquid market (like the S&P 500) compared to a low-liquidity environment (like a small-cap stock or a weekend crypto session).
- Institutional vs. Retail Flow: The “signature” of price movement changes depending on who is dominant in the market. As institutional algorithms evolve to hunt liquidity, the traditional “signals” produced by retail indicators can be used as “traps,” leading to failed breakouts or fake-outs.
How to Survive an Ever-Changing Market
Since no indicator is universal, successful trading requires Contextual Awareness.
A. Determine the Market Regime First
Before looking at your favorite indicator, analyze the market structure. Is the price making higher highs and higher lows (Trend), or is it bouncing between a clear horizontal ceiling and floor (Range)? Use your indicators only after you have identified the current regime.
B. Use a Complementary Toolkit
Avoid using three different oscillators (like RSI, Stochastics, and CCI) simultaneously, as they will likely tell you the same thing. Instead, combine an indicator that measures Trend with one that measures Volatility or Volume. This “multi-dimensional” view helps filter out false signals.
C. Adaptive Parameter Tuning
Some advanced traders use “adaptive” indicators that automatically adjust their look-back periods based on current volatility (e.g., the Kaufman Adaptive Moving Average). While not a perfect solution, it acknowledges that a fixed number in a formula cannot account for shifting market speeds.
Conclusion
Indicators are not crystal balls; they are specialized lenses. A microscope is the “perfect” tool for seeing bacteria, but it is useless for navigating a mountain range. Similarly, an indicator is only as good as the market condition it was built for. By letting go of the search for a universal indicator and focusing on regime identification, you can apply the right tool to the right environment.