Advanced Divergence Analysis for Professional Market Evaluation
Experienced traders understand that successful technical analysis depends on more than identifying overbought or oversold conditions. Markets often remain extended far longer than expected, and traditional oscillator signals can lose effectiveness without broader analytical context. The challenge lies in determining whether extreme market positioning reflects genuine trend strength or an emerging shift beneath the surface.
The Williams %R Double Divergence Indicator for TradingView is designed to address this challenge by combining the market-extreme perspective of Williams %R with PatternSmart’s confirmation-first Double Divergence methodology. Rather than encouraging isolated signal-based decisions, it helps traders evaluate divergence within a structured analytical framework that emphasizes context, confirmation, and disciplined interpretation.
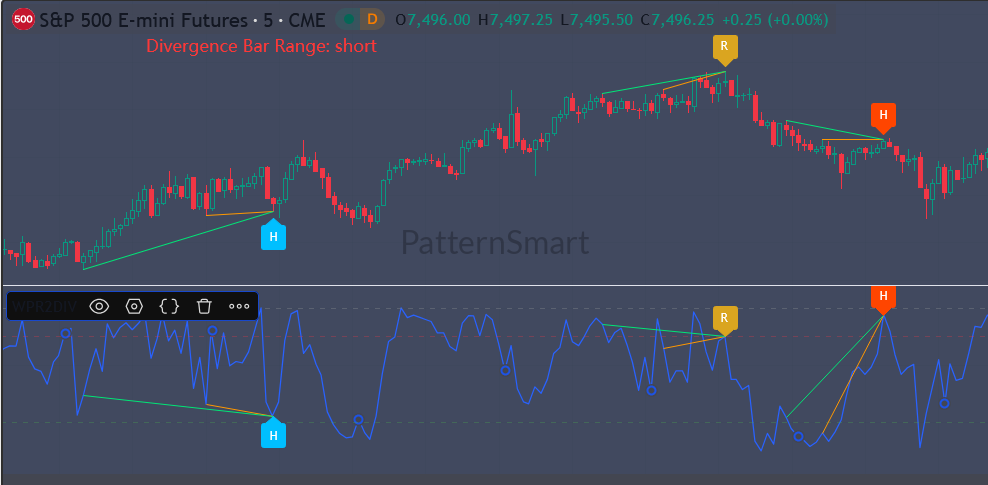
Understanding Market Extremes Beyond Overbought and Oversold
Williams %R has long been recognized as one of the fastest oscillators for identifying where current price closes relative to its recent trading range. Its responsiveness makes it particularly useful for highlighting periods when markets become statistically stretched.
However, professional traders rarely interpret overbought or oversold readings as automatic trading opportunities.
Strong trends frequently remain overbought for extended periods, while persistent bearish markets may remain oversold much longer than anticipated. Acting solely because Williams %R reaches an extreme often leads to premature entries against established market direction.
Instead, experienced analysts ask deeper questions:
- Is price still confirming the underlying market condition?
- Is buying or selling pressure beginning to lose conviction?
- Does the current extreme reflect continuation or exhaustion?
- Is additional confirmation supporting the observation?
These questions shift the focus from simple oscillator readings toward understanding changing market behavior.
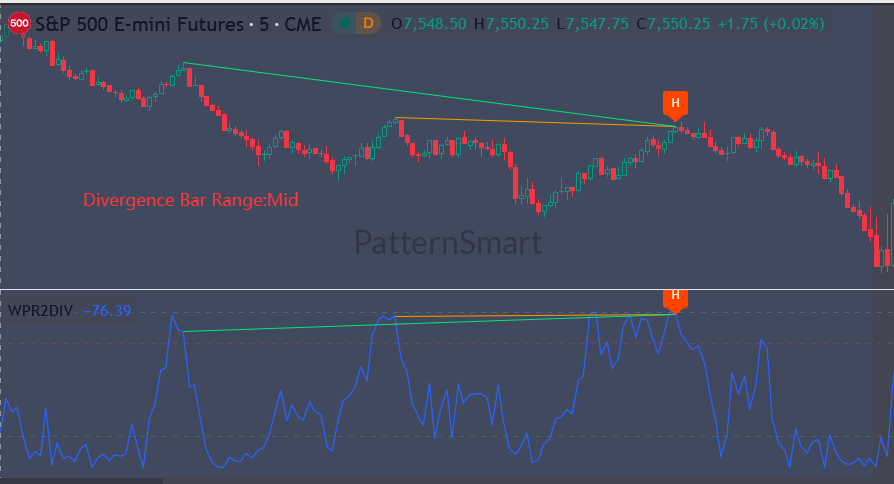
Why Divergence Adds Valuable Context
Divergence represents a disagreement between price action and the information measured by an indicator.
With Williams %R, that disagreement reflects changing market extremes rather than trend direction or momentum alone. When price continues reaching new highs or lows while Williams %R no longer confirms those extremes, traders gain additional evidence that market behavior deserves closer evaluation.
Equally important, hidden divergence may suggest that temporary pullbacks occur without fundamentally altering the broader market structure.
Neither observation predicts future price movement.
Instead, both contribute additional evidence that can strengthen analytical confidence when combined with price structure, trend analysis, support and resistance, and broader market context. This confirmation-based philosophy remains central to every PatternSmart Double Divergence product.
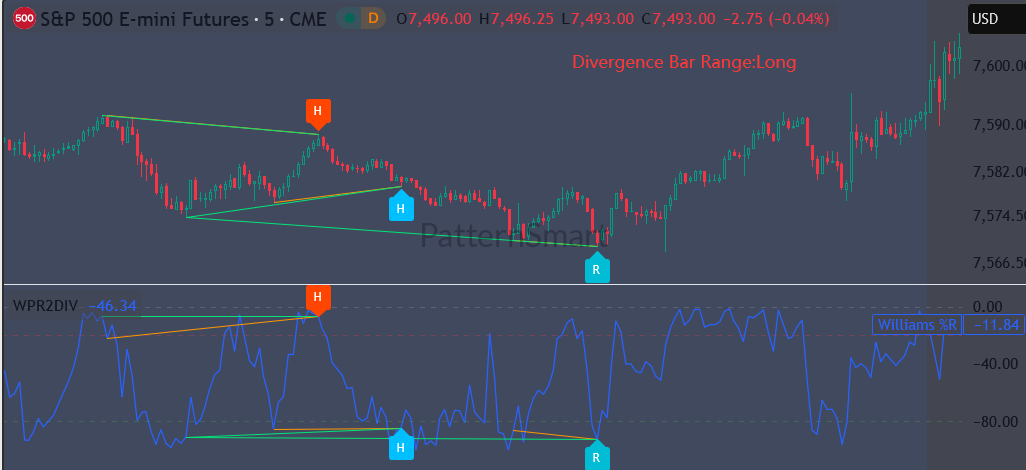
The Double Divergence Methodology
Traditional divergence is often treated as an isolated trading signal. The PatternSmart methodology approaches divergence differently.
Rather than encouraging immediate reactions, Double Divergence emphasizes a structured analytical process:
- Observe market behavior.
- Identify divergence between price and Williams %R.
- Evaluate surrounding market structure.
- Seek additional technical confirmation.
- Form an objective analytical conclusion.
This confirmation-first approach encourages disciplined evaluation instead of prediction. Divergence becomes one component of a broader analytical framework rather than a standalone trading system.
Because the methodology is independent of both indicator and platform, the same analytical principles remain consistent regardless of whether traders analyze equities, futures, Forex, cryptocurrencies, or commodities.
Built for Advanced TradingView Workflows
TradingView has become a preferred platform for experienced traders because it combines sophisticated charting with cloud-based accessibility and highly customizable workspaces.
Its synchronized layouts allow traders to monitor multiple markets and timeframes without sacrificing workflow efficiency. Watchlists, alerts, and interactive chart tools make it well suited for continuous market observation, while Pine Script integration enables advanced analytical indicators to operate naturally within the platform.
The Williams %R Double Divergence Indicator integrates directly into this environment, allowing divergence analysis to become part of an existing professional chart workflow rather than requiring separate analytical tools.
Professional Features That Support Analysis
Instead of overwhelming traders with unnecessary complexity, the indicator focuses on capabilities that directly improve divergence evaluation.
Automatic Double Divergence Detection
The indicator continuously evaluates Williams %R against price action to identify both Regular and Hidden Divergence without requiring manual comparison. This reduces repetitive visual analysis while helping traders maintain analytical consistency.
Bullish and Bearish Signal Identification
Both bullish and bearish divergence scenarios are displayed using the official PatternSmart signal classifications, allowing traders to evaluate changing market conditions within the same structured methodology used across the entire Double Divergence product family.
Flexible Visual Presentation
Experienced traders often customize charts for different trading styles and asset classes. Configurable display options allow the indicator to integrate cleanly into individual TradingView workspaces without compromising chart readability.
Customizable Alert Support
Monitoring multiple instruments simultaneously can become impractical. Alert functionality allows traders to remain aware when predefined divergence conditions develop, enabling them to evaluate opportunities as part of their broader analytical process rather than continuously watching every chart.
Read the master guide on the Double Divergence Indicator Series.
Visit the Technical Inputs Manual: Double Divergence Pro for full parameter tuning.
The WilliamsR Double Divergence Pro indicator is available in these platforms: Ctrader, MetaTrader(MT4, MT5), NinjaTrader 8, MultiCharts, MultiCharts x.NET, Tradingview, Prorealtime(subchart only), SierraChart.
Practical Benefits for Experienced Traders
The Williams %R Double Divergence Indicator is designed to enhance technical evaluation rather than replace trader judgment.
Professional users may benefit from:
- More objective evaluation of market extremes.
- Additional confirmation during potential reversal analysis.
- Improved identification of weakening participation near extended price movements.
- Greater consistency when interpreting Regular and Hidden Divergence.
- Reduced manual effort when monitoring numerous TradingView charts.
- Better organization of technical evidence before making trading decisions.
These benefits support disciplined market analysis without implying certainty or guaranteeing future outcomes.
Suitable Markets
Because Williams %R evaluates relative price positioning rather than market-specific characteristics, the indicator can be applied across numerous asset classes, including:
- Stocks
- Futures
- Forex
- Cryptocurrencies
- Commodities
- Indices
The underlying methodology remains unchanged regardless of market or timeframe, allowing traders to apply a consistent analytical process across diverse trading environments.
Frequently Asked Questions
What makes Williams %R Double Divergence different from a standard Williams %R indicator?
A traditional Williams %R indicator highlights overbought and oversold conditions. The Double Divergence version extends this analysis by evaluating disagreements between price action and Williams %R, providing additional confirmation that supports broader market interpretation.
Does divergence predict market reversals?
No. Divergence should be viewed as analytical evidence rather than a prediction. It may indicate changing market behavior, but confirmation from price action and other technical factors remains essential before drawing conclusions.
Does the indicator identify both Regular and Hidden Divergence?
Yes. It detects both divergence classifications, allowing traders to evaluate potential trend continuation as well as situations where market conditions may be changing.
Which traders benefit most from this indicator?
The indicator is particularly suited to intermediate and advanced traders who already incorporate market structure, price action, and confirmation into their decision-making process.
Can it be used across multiple TradingView timeframes?
Yes. Since the methodology is independent of timeframe, traders can incorporate the indicator into multi-timeframe analysis according to their own trading approach.
Conclusion
Williams %R provides valuable insight into market extremes, but experienced traders recognize that extreme readings alone rarely provide sufficient evidence for professional decision-making.
By combining Williams %R with PatternSmart’s Double Divergence methodology, traders gain a structured framework for evaluating divergence through confirmation, context, and objective technical analysis. Rather than emphasizing prediction, the methodology promotes disciplined interpretation and consistent market evaluation across all supported asset classes and trading styles.
Explore Williams %R Double Divergence for TradingView
If your analytical process emphasizes confirmation over isolated signals and structured evaluation over prediction, the PatternSmart Williams %R Double Divergence Indicator provides a professional framework for incorporating divergence analysis into your TradingView workflow. Discover how confirmation-first technical analysis can enhance your interpretation of market extremes while maintaining the flexibility and efficiency that advanced TradingView users expect.