Johnson & Johnson (JNJ) Weekly Technical Analysis: Evaluating Multi-Year Price Structure and Stochastics Double Divergence
Market Overview
The weekly candlestick chart for Johnson & Johnson (JNJ) displays a multi-year market structure spanning from late 2019 through late 2023. The chart illustrates a complete structural evolution: an initial recovery and long-term uptrend leading to a peak near $186.00 in early 2022, followed by a protracted, multi-wave corrective decline that brought prices down toward the $145.00–$150.00 demand area before stabilizing into a late-2023 recovery.
Across this structural progression, JNJ generated three distinct Double Divergence patterns on the Stochastics indicator panel—including a Hidden Bullish Double Divergence during the primary uptrend, a Regular Bearish Double Divergence at the absolute macro peak, and a Regular Bullish Double Divergence near the corrective lows. Analyzing these multi-point momentum signals alongside price action provides clear insight into how momentum exhaustion and structural support intersect over macro timeframes.
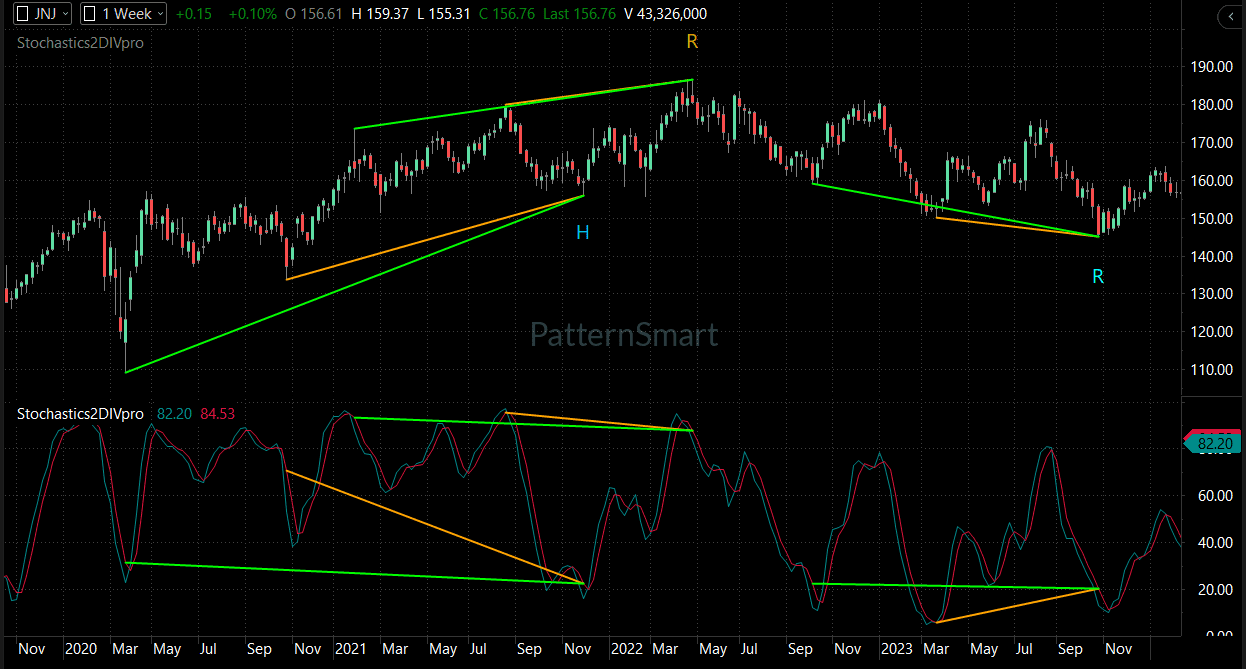
Chart Setup
- Instrument: Johnson & Johnson
- Symbol: JNJ
- Timeframe: Weekly (1 Week)
- Chart Type: Candlestick Price Chart
- Primary Indicator: Stochastics Double Divergence (
Stochastics2DIVpro, currently reading %K 82.20, %D 84.53) - Last Visible Price: $156.76 (Weekly OHLC: Open $156.61, High $159.37, Low $155.31, Close $156.76)
Price Action Analysis
Price action on the weekly JNJ chart highlights several multi-month macro phases:
- 2020 Liquidity Low & Rebound (March 2020 – Late 2020): Following a steep market-wide drop in early 2020 near $110.00, JNJ staged an aggressive recovery, establishing a higher-low base near $135.00 in late 2020.
- Impulsive Uptrend Expansion (2021 – Early 2022): The stock steadily forged higher highs and higher lows, climbing through intermediate resistance at $160.00 and $175.00, culminating in an all-time peak near $186.00 in April 2022.
- Corrective Downtrend & Complex Range (Mid-2022 – Mid-2023): After rejecting the $186.00 peak, JNJ transitioned into a lower-high, lower-low sequence. Pullbacks repeatedly retested structural support around $160.00, $150.00, and ultimately $145.00.
- Demand Floor Base & Recovery (Late 2023): Upon reaching the $145.00–$146.00 zone in late 2023, selling pressure dissipated. Price formed a double-bottom structure and rallied back toward $156.76.
Trend Analysis
The macro and short-term trends present a clear structural transition across the weekly timeframe:
- Primary Macro Trend (2020–2022): Strongly Bullish. Defined by an ascending sequence of major higher lows ($110.00 → $135.00 → $155.00) and higher highs ($155.00 → $175.00 → $186.00).
- Intermediate Corrective Trend (2022–2023): Bearish to Range-Bound. The failure at $186.00 established an intermediate downtrend that systematically broke below prior higher lows before finding major demand at $145.00.
- Current Short-Term Trend: Neutral to Bullish Recovery. Price has bounced off the $145.00 structural floor and is testing the $156.00–$160.00 pivot zone.
Key Support and Resistance Levels
Key price zones visible on the weekly chart include:
- Major Overhead Resistance ($180.00 – $186.00): The macro historical peak established in April 2022, which aligns with the Regular Bearish Double Divergence signal.
- Intermediate Resistance / Pivot Zone ($160.00 – $170.00): A major horizontal reaction band that served as key support during 2021–2022 and now acts as overhead resistance during recoveries.
- Major Structural Support Floor ($145.00 – $150.00): A critical historical demand zone that held the late-2023 selling pressure, marked by the Regular Bullish Double Divergence signal.
- Macro Baseline Demand ($135.00): The late-2020 structural higher low that acted as the baseline anchor for the primary bull move.
Momentum Analysis
The subchart panel displays the Stochastics2DIVpro oscillator (currently printed at 82.20 / 84.53 in overbought territory). The oscillator demonstrates multi-year momentum cycles:
- Bullish Expansion Cycles: Oscillator peaks consistently reached overbought levels (>80.00) during major price advances in 2020, 2021, and early 2022.
- Deep Corrective Troughs: Bearish legs pulled the Stochastic lines deep into oversold territory (<20.00) in late 2020, late 2021, early 2023, and late 2023.
- Multi-Point Divergence Signatures: Over the multi-year chart, the Stochastic oscillator formed three distinct multi-point divergence alignments against price structure, reflecting trend continuation, major top exhaustion, and major bottom exhaustion.
Signal-by-Signal Double Divergence Analysis
The chart features three distinct Double Divergence setups, each evaluated below in detail.
                    ┌─────────────────────────────────────────┐
                    │      JNJ DOUBLE DIVERGENCE SIGNALS      │
                    └────────────────────┬────────────────────┘
                                         │
        ┌────────────────────────────────┼────────────────────────────────┐
        ▼                                ▼                                ▼
┌───────────────┐                ┌───────────────┐                ┌───────────────┐
│  Signal #1    │                │  Signal #2    │                │  Signal #3    │
│ Hidden Bullish│                │Regular Bearish│                │Regular Bullish│
│      "H"      │                │      "R"      │                │      "R"      │
│ (Continuation)│                │  (Reversal)   │                │  (Reversal)   │
└───────────────┘                └───────────────┘                └───────────────┘
Signal #1: Hidden Bullish Double Divergence (“H”) — November 2021
- Divergence Type: Hidden Bullish Double Divergence (“H”).
- Expected Market Behavior: Potential trend continuation (bullish resumption following a pullback within an established macro uptrend).
- Where It Appears: Culminates at the November 2021 price low near $155.00, marked by a cyan “H” below the chart. It connects the price low of March 2020 ($110.00 base) and late 2020 ($135.00 low) to the November 2021 pullback low ($155.00).
- Price Movement: Price maintained clear higher lows across the three reference points ($110.00 → $135.00 → $155.00), as illustrated by the ascending green trendline on the price panel.
- Indicator Movement: On the
Stochastics2DIVpropanel, the oscillator printed equal to deeper lower troughs across these same reference points (connected by the descending orange and green trendlines near the oversold line), dropping heavily despite price holding well above prior lows. - Market Context & Interpretation: This combination—price holding higher structural support while indicator momentum falls sharply—defines Hidden Bullish Double Divergence. It indicated that sellers were expending significant momentum to push price down, yet buyers easily absorbed the supply at higher price floors.
- Actual Market Behavior & Confirmation: The signal succeeded cleanly. Following the “H” designation in November 2021, price launched an aggressive upward leg from $155.00, breaking above $175.00 and driving directly to the all-time high near $186.00 in April 2022.
Signal #2: Regular Bearish Double Divergence (“R”) — April 2022 Macro Top
- Divergence Type: Regular Bearish Double Divergence (“R”).
- Expected Market Behavior: Potential major trend exhaustion and bearish reversal.
- Where It Appears: Formed across three major weekly price peaks between late 2020, mid-2021, and April 2022, labeled with a yellow “R” above the macro high at $186.00.
- Price Movement: Price printed three progressively higher highs ($175.00 in late 2020 → $179.00 in mid-2021 → $186.00 in April 2022), highlighted by the ascending green line across the price peaks.
- Indicator Movement: The Stochastic subchart panel printed lower momentum peaks across these corresponding price highs (connected by the descending green/orange trendline near the overbought zone), failing to confirm the final price push.
- Market Context & Interpretation: This multi-year alignment represented classic buying exhaustion. While buyers pushed price to marginal new record highs, the underlying velocity and volume intensity declined across two consecutive historical reference points.
- Actual Market Behavior & Confirmation: The signal succeeded as a major reversal marker. Following the appearance of the “R” signal in April 2022, JNJ experienced a sharp rejection off $186.00, initiating a multi-month downtrend that broke below $160.00 and eventually reached $145.00, completely bringing the multi-year bull trend to an end.
Signal #3: Regular Bullish Double Divergence (“R”) — October 2023 Macro Floor
- Divergence Type: Regular Bullish Double Divergence (“R”).
- Expected Market Behavior: Potential trend exhaustion and bullish reversal following a prolonged decline.
- Where It Appears: Formed across three major corrective troughs between late 2022, early 2023, and October 2023, labeled with a cyan “R” below the October 2023 swing low near $145.00.
- Price Movement: Price made three progressively lower price lows ($160.00 in late 2022 → $150.00 in early 2023 → $145.00 in October 2023), as shown by the descending green/orange trendlines on the price chart.
- Indicator Movement: The Stochastic oscillator failed to confirm the new price low in October 2023. Instead, the indicator formed equal to higher troughs across those reference points (highlighted by the horizontal green and ascending orange trendlines near the 20.00 oversold line).
- Market Context & Interpretation: This structural misalignment indicated severe downward momentum exhaustion. Although supply was sufficient to press price to marginal new lows near $145.00, the underlying selling velocity had completely dried up across two historical reference points.
- Actual Market Behavior & Confirmation: The signal was confirmed as price formed a bullish rejection off the $145.00 floor and rallied back above $156.00 by late 2023, initiating a weekly recovery leg and pushing Stochastics back into overbought territory (82.20).
Price Confirmation vs. Indicator Signal
Distinguishing between signal generation and price confirmation is essential for proper technical analysis:
- Indicator Signal: A Double Divergence signal alerts traders to an imbalance between price structure and momentum across three swing points. For instance, the October 2023 “R” signal flagged selling exhaustion at $145.00.
- Price Confirmation: The signal is only confirmed when price acts on that momentum condition—in this case, by printing weekly bullish candles off $145.00 and closing above local swing resistance near $152.00–$155.00. Without price confirmation, divergence patterns can extend further into prolonged trends.
Technical Scenarios
                       ┌─────────────────────────────────────────┐
                       │        JNJ CONDITIONAL SCENARIOS        │
                       └────────────────────┬────────────────────┘
                                            │
        ┌───────────────────────────────────┼───────────────────────────────────┐
        ▼                                   ▼                                   ▼
┌───────────────┐                   ┌───────────────┐                   ┌───────────────┐
│Bullish Scenario│                  │Bearish Scenario│                  │Neutral Scenario│
├───────────────┤                   ├───────────────┤                   ├───────────────┤
│• Hold > $150  │                   │• Break < $145 │                   │• Range $150   │
│• Break > $160 │                   │• Target $135  │                   │  to $160      │
│• Target $170  │                   │• Invalidates  │                   │• Oscillator   │
│  Resistance   │                   │  Reversal     │                   │  Normalizes   │
└───────────────┘                   └───────────────┘                   └───────────────┘
Bullish Scenario
If price maintains its hold above the $150.00–$152.00 support base and achieves a weekly close above $160.00, buyers could extend the current recovery toward the intermediate resistance band at $170.00–$175.00, continuing the reversal initiated by the October 2023 Regular Bullish Double Divergence.
Bearish Scenario
If selling pressure resumes and forces a weekly close below the critical $145.00 support floor, it would break the bottoming structure and signal a continuation of the intermediate downtrend toward the macro $135.00 demand floor.
Neutral / Range Scenario
With the weekly Stochastic lines currently elevated near 82.20 / 84.53, price may trade sideways between $150.00 support and $160.00 resistance, allowing overbought momentum to cool while digesting recent gains.
Risk and Invalidation
- Bullish Reversal Invalidation: A weekly close below $145.00 invalidates the Regular Bullish Double Divergence bottoming pattern and opens downside risk toward $135.00.
- Bearish Macro Invalidation: A weekly close above $186.00 would fully invalidate the multi-year macro top structure established by the April 2022 Regular Bearish Double Divergence.
Key Levels Summary
| Level / Zone | Role | Technical Significance |
| $180.00 – $186.00 | Major Overhead Resistance | Macro record high; location of April 2022 Bearish Double Divergence (“R”). |
| $160.00 – $170.00 | Major Resistance / Pivot | Key intermediate horizontal resistance boundary. |
| $156.76 | Current Price Level | Recent weekly closing price ($156.76). |
| $145.00 – $150.00 | Major Structural Support | Critical demand floor; location of October 2023 Bullish Double Divergence (“R”). |
| $135.00 | Macro Demand Base | Late-2020 structural floor and major secondary support. |
Technical Outlook
The multi-year weekly chart for Johnson & Johnson demonstrates how Double Divergence signals track the lifecycle of a major market trend. The 2020–2022 uptrend was sustained by a Hidden Bullish Double Divergence (“H”) at $155.00, which correctly signaled trend continuation to $186.00. The ultimate top was flagged by a Regular Bearish Double Divergence (“R”) at $186.00, which presaged a major multi-month decline.
Most recently, the drop to $145.00 produced a Regular Bullish Double Divergence (“R”), triggering a successful rebound to $156.76. As long as JNJ respects the $145.00 structural floor, the broader recovery thesis remains intact.
Educational Conclusion
This weekly JNJ chart provides three vital lessons on analyzing technical divergence:
- Divergence Displays Distinct Roles: Hidden divergence (“H”) identifies continuation pullbacks within established trends, whereas Regular divergence (“R”) identifies major structural trend exhaustion and potential reversals.
- Three-Point Alignment Filters Noise: On macro timeframes like the weekly chart, requiring a three-point structural alignment prevents traders from acting on single-swing momentum anomalies.
- Always Anchor Analysis to Price Structure: Indicators reflect velocity, but price levels dictate survival. An indicator signal gains trading value only when supported by price action holding or breaking key support and resistance floors.
Frequently Asked Questions
What do the cyan “H” and yellow “R” markers on the JNJ weekly chart mean?
The cyan “H” stands for Hidden Bullish Double Divergence (signaling trend continuation), while the yellow and cyan “R” markers stand for Regular Double Divergence (signaling trend reversal—bearish at tops, bullish at bottoms).
How effective was the Regular Bearish Double Divergence signal at $186.00?
It was highly effective. The signal warned that momentum was failing despite higher price highs, correctly marking the macro top near $186.00 before a major decline carried JNJ down to $145.00.
What is the primary difference between Hidden and Regular Double Divergence?
Regular Double Divergence compares higher price highs (or lower price lows) against lower indicator peaks (or higher indicator troughs) to identify trend reversals. Hidden Double Divergence compares higher price lows (or lower price highs) against lower indicator troughs (or higher indicator peaks) to identify trend continuation.
What price level invalidates the recent bullish reversal setup on JNJ?
A weekly close below the $145.00 major structural support floor would invalidate the Regular Bullish Double Divergence bottom setup.
Looking for the complete mathematical breakdown, step-by-step optimization guides, and advanced trading strategies? Explore our comprehensive documentation:
Visit the Technical Inputs Manual: Double Divergence Pro for full parameter tuning.
Read the master guide on the Double Divergence Indicator Series.