Evaluating overextended market conditions requires identifying the precise moment price behavior and internal market momentum begin to disconnect. While traditional indicators can highlight relative price extremes, relying solely on overbought or oversold levels during strong trends often leads to premature counter-trend position taking.
The Williams%R Double Divergence Pro for MultiCharts .NET brings a structured, confirmation-first methodology to relative price positioning analysis. Designed specifically for quantitative developers and professional discretionary traders operating within C# and the .NET framework, this indicator combines the responsive range-based calculations of Williams %R with PatternSmart’s proprietary Double Divergence technology to deliver institutional-grade market evaluation.
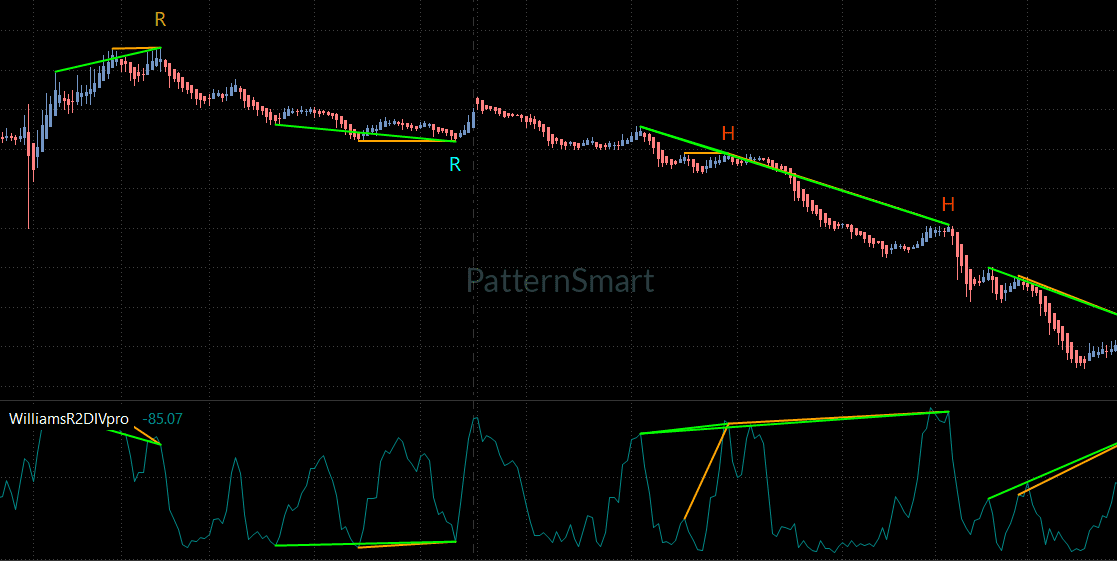
Understanding the Market Challenge: Relative Price Positioning & Momentum Exhaustion
A primary challenge in mean-reversion analysis is distinguishing between a temporary price extreme that will continue expanding and an overextended market that is losing underlying momentum.
Range-Based Price Extremes
Financial markets continuously cycle between expansion and equilibrium. When price advances rapidly toward the upper boundary of its recent historical range, standard oscillators naturally reach extreme high values. However, during powerful directional trends, price can remain pinned at relative extremes for extended periods, causing traditional indicators to generate persistent, premature reversal signals.
Momentum Exhaustion vs. Range Expansion
Price action alone reflects the visible outcome of market participation. What remains hidden on standard charts is the rate of momentum change within those range extremes. A market making a new high on declining internal momentum demonstrates momentum exhaustion. Conversely, if price pushes to new highs with accelerating momentum, the move represents structural trend expansion.
Identifying when price reaches a new extreme while internal momentum declines requires comparing price structure against indicator behavior—a process known as divergence analysis.
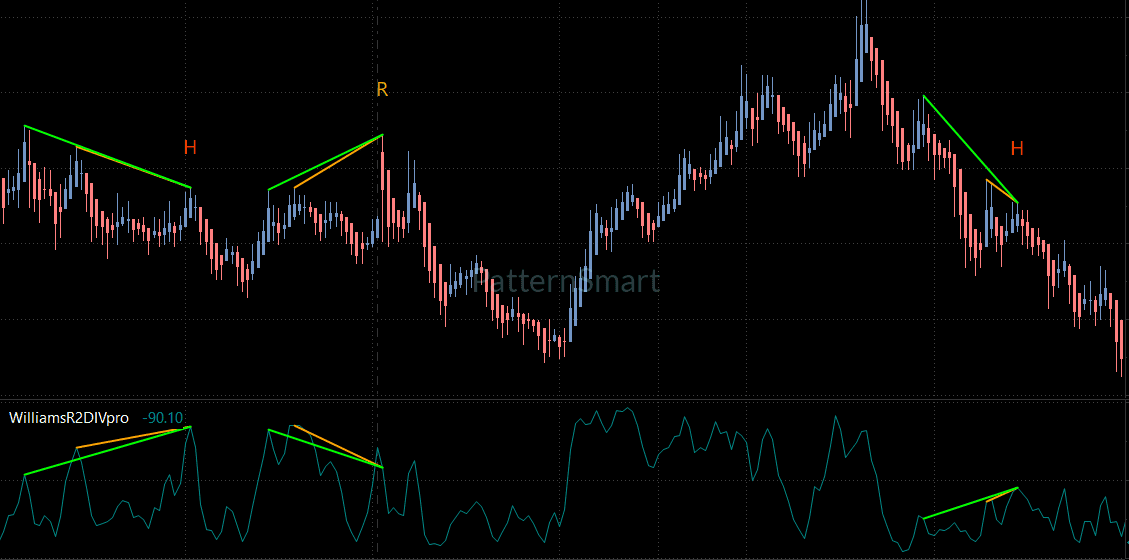
Understanding Williams %R: Evaluating Market Extremes
Developed by Larry Williams, Williams %R is a classic oscillator-based indicator that measures the relative position of the current closing price in relation to the high-low range over a specified lookback period (typically 14 periods).
$$\%R = \frac{\text{Highest High} – \text{Close}}{\text{Highest High} – \text{Lowest Low}} \times -100$$
Indicator Characteristics & Strengths
- Scale & Orientation: Bounded between $0$ and $-100$. Values from $0$ to $-20$ represent the upper extreme of the recent range, while values from $-80$ to $-100$ represent the lower extreme.
- Extreme Responsiveness: Because it evaluates raw closing prices directly against the recent high-low boundary without exponential smoothing, Williams %R is exceptionally sensitive to sudden shifts in short-term momentum.
- Mean-Reversion Suitability: It excels in range-bound markets and cyclical environments where evaluating overextended price movement relative to equilibrium is essential.
Limitations of Standalone Williams %R
Because of its high responsiveness, standalone Williams %R frequently produces rapid swings into extreme territory. In strong, trending environments, interpreting simple moves into the $-20$ or $-80$ zones as automated counter-trend signals exposes traders to severe trend continuation risk. Williams %R requires a structured confirmation framework to separate ordinary range expansion from genuine momentum exhaustion.
Why Double Divergence Matters
The PatternSmart Double Divergence methodology transforms raw divergence observations into a confirmation-first technical framework. Divergence represents an information shift—an analytical observation that price action and indicator behavior are no longer moving in agreement—rather than a guaranteed prediction.
       REGULAR BEARISH DIVERGENCE                  BULLISH HIDDEN DIVERGENCE
         (Reversal Potential)                        (Trend Continuation)

    Price:   Higher High (HH)                 Price:   Higher Low (HL)
               /\       /\                             \       /
              /  \     /  \                             \     /
             /    \   /    \                             \   /
            /      \ /      \                             \ /
    -----------------------------------      -----------------------------------
    Indicator: Lower High (LH)                Indicator: Lower Low (LL)
               /\
              /  \     /\                                \       /
             /    \   /  \                                \     /
            /      \ /    \                                \   /
                                                            \ /
Signal Classification Framework
Double Divergence categorizes structural disagreements between price and Williams %R into four distinct, objective observations:
- Bullish Regular Divergence: Price forms a Lower Low while Williams %R forms a Higher Low. This indicates that despite lower prices, selling momentum within the lower end of the range is deteriorating, signaling potential bullish reversal.
- Bearish Regular Divergence: Price forms a Higher High while Williams %R forms a Lower High. This suggests that buying pressure at relative price extremes is weakening, pointing to potential bearish reversal.
- Bullish Hidden Divergence: Price forms a Higher Low while Williams %R forms a Lower Low. This indicates that despite a deeper indicator pullback into oversold territory, price structure maintained a higher trough, supporting bullish trend continuation.
- Bearish Hidden Divergence: Price forms a Lower High while Williams %R forms a Higher High. This suggests that price failed to make a higher peak despite the indicator bouncing sharply into overbought territory, supporting bearish trend continuation.
By requiring structural confirmation across price swings and indicator turning points, the Double Divergence engine filters out market noise and reduces premature signals.
MultiCharts .NET Integration & C# Workflow
MultiCharts .NET provides an advanced environment built for quantitative developers, systematic traders, and C# programmers who demand object-oriented architecture, high-precision backtesting, and robust programmatic control.
Programmatic & Visual Integration
Williams %R Double Divergence Pro integrates into the MultiCharts .NET environment via object-oriented architecture. Whether deployed within standard MultiCharts .NET chart windows for discretionary analysis or referenced directly within custom C# strategies via the MultiCharts .NET API, the indicator delivers consistent structural evaluation.
High-Performance Backtesting & Strategy Optimization
For quantitative researchers building automated mean-reversion algorithms in C#, the indicator’s object-oriented structure allows seamless integration into .NET strategy scripts. Custom strategy classes can evaluate confirmed divergence outputs alongside risk parameters, portfolio constraints, and order execution logic, ensuring complete strategy validation prior to live deployment.
Key Indicator Features
The Williams %R Double Divergence Pro indicator includes a suite of configurable parameters managed through standardized inputs.
1. Wait 1 Bar (Wait 1 Bar = True)
- Category: Signal Generation
- Behavior: When enabled, the indicator waits for the bar following a detected divergence structure to complete before finalizing and confirming the signal.
- Analytical Benefit: Prevents false signals caused by intrabar price fluctuations, ensuring that divergence signals are grounded in completed price bars.
2. Enhanced Mode (Enhanced Mode = False)
- Category: Signal Filtering
- Behavior: Applies an additional structural validation layer to detected divergence events, evaluating geometric relationships and anchor-point consistency.
- Analytical Benefit: Filters out lower-quality or noisy divergence structures, reserving confirmed signals for highly defined technical setups.
3. Divergence Bar Range (ShortRange)
- Category: Advanced Parameters
- Behavior: Establishes the historical search boundary between divergence anchor points. Options include
ShortRange,MidRange, andLongRange. - Analytical Benefit: Allows traders to align structural search parameters with specific timeframes and market dynamics—such as compact intraday swings or broader daily structures.
4. Divergence Lookback (5) & Filter Length (5)
- Category: Advanced Parameters
- Behavior:
Divergence Lookbackcontrols the historical bar count evaluated when identifying local swing highs and lows.Filter Lengthapplies internal calculation smoothing to the structural evaluation engine. - Analytical Benefit: Provides precise programmatic control over swing-point detection sensitivity and noise reduction across diverse asset classes.
5. Multi-Channel Alert System (Enable Alert = True)
- Category: Alerts & Notifications
- Behavior: Triggers native MultiCharts .NET visual popups, audio notifications (
Alert Sound), and programmatic alert events upon signal confirmation. - Analytical Benefit: Keeps traders informed of newly confirmed technical conditions across multi-chart workspaces without requiring manual screen monitoring.
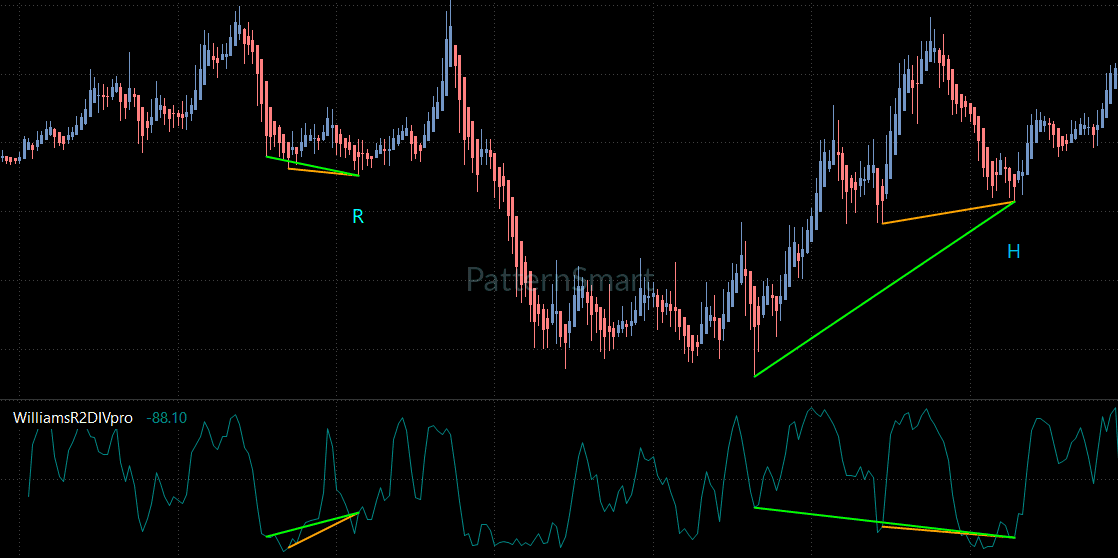
Practical Trading Benefits
+-----------------------------------------------------------------------------------+
|                        PRACTICAL ANALYTICAL BENEFITS                              |
+-----------------------------------+-----------------------------------------------+
| BENEFIT                           | ANALYTICAL IMPACT                             |
+-----------------------------------+-----------------------------------------------+
| Objective Extreme Evaluation      | Separates genuine exhaustion from structural   |
|                                   | range expansion.                              |
+-----------------------------------+-----------------------------------------------+
| Systematic Noise Reduction        | Combines Wait 1 Bar and Enhanced Mode to      |
|                                   | minimize premature counter-trend entries.     |
+-----------------------------------+-----------------------------------------------+
| Dual Reversal & Continuation      | Analyzes both Regular (reversal) and Hidden   |
| Framework                         | (continuation) divergence simultaneously.     |
+-----------------------------------+-----------------------------------------------+
| Seamless .NET Strategy Testing    | Supports structured C# strategy development,  |
|                                   | backtesting, and portfolio optimization.      |
+-----------------------------------+-----------------------------------------------+
Frequently Asked Questions
How does Williams %R Double Divergence differ from RSI Double Divergence?
While RSI measures momentum over a smoothed exponential average across all price changes, Williams %R measures the current close strictly relative to the highest high and lowest low of a specified lookback window. Consequently, Williams %R is significantly more responsive to relative price placement within recent ranges, making it suited for mean-reversion and cyclical range analysis.
Can I reference Williams %R Double Divergence signals programmatically in C#?
Yes. MultiCharts .NET allows developers to reference indicator outputs directly within custom C# strategy scripts. Signals can be accessed programmatically to trigger automated orders, adjust position sizing, or enforce risk management rules.
Does the indicator generate signals intrabar or on bar close?
By default, the Wait 1 Bar input is set to True, requiring the confirmation bar to close before finalizing a signal. This eliminates signal repaint and ensures backtesting fidelity. If set to False, signals evaluate intrabar but remain unconfirmed until bar completion.
What markets and timeframes are best suited for this indicator?
The indicator is asset- and timeframe-independent. It performs exceptionally well in liquid, range-bound, or cyclical markets—such as index futures, major Forex pairs, and high-volume equities—across tick, minute, daily, or volume-based chart intervals.
Professional Technical Analysis for MultiCharts .NET
The Williams%R Double Divergence Pro for MultiCharts .NET provides a structured, probability-based methodology for evaluating relative price extremes. By combining the range sensitivity of Williams %R with PatternSmart’s confirmation-first Double Divergence framework, quantitative developers and discretionary traders gain a transparent tool for analyzing market exhaustion and continuation.
[Get Started With Williams%R Double Divergence Pro for MultiCharts x.NET]
Looking for the complete mathematical breakdown, step-by-step optimization guides, and advanced trading strategies? Explore our comprehensive documentation:
Visit the Technical Inputs Manual: Double Divergence Pro for full parameter tuning.
Read the master guide on the Double Divergence Indicator Series.