INTC Technical Analysis: Why the Hidden Bullish Double Divergence Signal Failed
Market Overview
The daily chart for Intel Corp (INTC) shows a dramatic shift in market conditions over a multi-month period. Beginning in March, the stock underwent an aggressive upward expansion, climbing rapidly from the $40.00 base area to a major peak above $130.00 by late June. Following this peak, the stock experienced a sharp drop toward $100.00 in early June, recovered toward the $130.00 area, and then suffered a steep sell-off into early July, dropping back down to test the $108.60–$110.00 zone. Following this sell-off, price action failed to launch a meaningful recovery or continue its primary uptrend, instead deteriorating into a sustained downward trend toward $89.47.
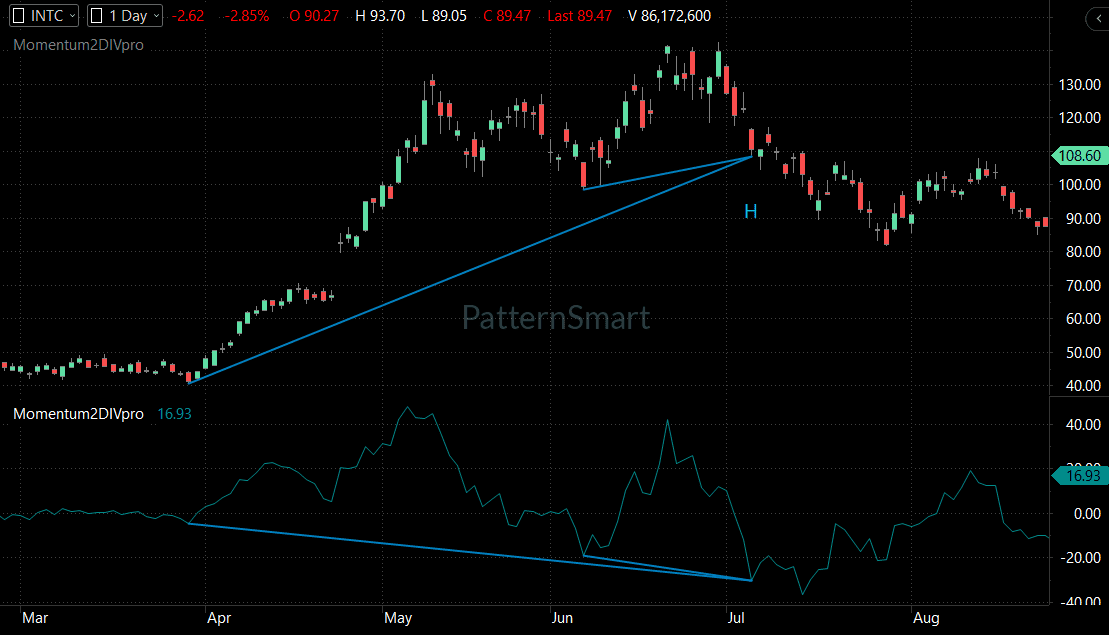
Chart Setup
- Instrument: Intel Corp
- Symbol: INTC
- Timeframe: Daily (1 Day)
- Chart Type: Candlestick Price Chart
- Primary Indicator: Momentum Double Divergence (
Momentum2DIVpro)
Price Action Analysis
During the initial leg of the rally from March through April, price action was characterized by strong bullish candlesticks with minimal pullbacks. After peaking above $130.00, price printed a deep swing low in early June near $100.00 before rallying back up toward the highs.
A second, higher swing low formed in early July near $108.60 (marked on the chart by the blue indicator anchor point “H”). Standard price structure at this point reflected a series of higher lows relative to the late-March launch point (~$42.00) and the early-June swing low (~$100.00). However, immediately following the formation of the higher low near $108.60, the expected bullish reaction was extremely weak. Price printed small, hesitating candles before breaking decisively below the $108.60 support level, printing lower highs and lower lows through August.
Trend Analysis
The primary trend leading into late June was strongly bullish. However, the structural dynamic transitioned rapidly:
- Primary Trend: Bullish from March to late June.
- Short-Term Trend: Bearish transition following the late-June peak, turning into a confirmed downtrend by July and August.
- Trend Structure: The failure to hold higher lows destroyed the long-term bullish market structure, shifting the market into a broader corrective/bearish phase.
Key Support and Resistance Levels
- Major Resistance ($130.00 – $135.00): The multi-month double-top region reached in late May and late June.
- Breakdown Level / Prior Support ($108.60 – $110.00): The early July swing low where the Hidden Bullish Double Divergence signal anchored. Once broken, it acted as overhead resistance.
- Intermediate Support ($100.00): The early June swing low.
- Current Level / Current Support ($89.00 – $89.47): The August swing low area where price currently trades.
Momentum Analysis
The lower panel displays the Momentum2DIVpro oscillator. Throughout the uptrend from March to June, momentum expanded into positive territory, peaking above 40.00. During the subsequent pullbacks in June and July, momentum plummeted sharply, crossing well below the zero line to reach multi-month lows around -30.00 to -35.00.
While price made higher lows across its major swing points, momentum made substantially lower troughs. This structural disagreement between price holding higher levels while momentum printed deeper lows formed the foundation of the double divergence setup.
Momentum Double Divergence Analysis
The chart displays a Hidden Bullish Double Divergence signal (denoted by the blue anchor lines connecting three points on price and momentum, marked with an “H”).
- Price Behavior: Price established three progressive swing lows where each reference point remained higher than the previous: late March (~$42.00), early June (~$100.00), and early July ($108.60). This preserved the macro higher-low price structure.
- Indicator Behavior: The
Momentum2DIVproindicator failed to confirm the higher price lows. Instead, it printed significantly lower troughs across the corresponding timeframes, sloping downward across both historical reference points. - Theoretical Implication: A Hidden Bullish Double Divergence indicates structural bullish strength—suggesting that despite severe drops in momentum, buyers are holding price at higher levels, signaling high probability for trend continuation.
Why the Double Divergence Signal Failed
Despite the multi-point momentum alignment, the Hidden Bullish Double Divergence failed to generate a meaningful price reversal or continuation. Several clear chart-based reasons explain why this signal invalidated:
- Lack of Bullish Price Confirmation: A divergence signal is merely a setup, not an automatic buy trigger. Following the July signal at $108.60, price failed to produce strong bullish confirmation candles (such as impulse engulfing bars or a higher-high breakout).
- Overhead Supply & Rejection: The drop from the $130.00 peak in late June was swift and aggressive. The immense selling pressure created severe overhead supply, overpowering the subtle structural support at $108.60.
- Severe Momentum Collapse: The momentum indicator did not just dip slightly; it crashed to extreme negative levels below -30.00. When momentum falls this deep below the baseline, it indicates that bear pressure is overwhelming, making a continuation of the prior uptrend statistically less likely regardless of price holding higher lows.
- Immediate Key Level Breakdown: Instead of bouncing off $108.60, price consolidated briefly and then broke decisively below the level, invalidating the higher-low structure required for hidden bullish divergence.
Confirmation
For this Hidden Bullish Double Divergence signal to have been confirmed, the following chart events were required:
- A strong bullish reversal candle holding above the $108.60 level.
- Momentum curling back above the zero baseline.
- A structural price break back above local short-term resistance ($115.00–$120.00).
None of these confirmation conditions occurred. Instead, price confirmed a bearish breakdown by closing below $108.60 and printing consecutive lower lows toward $89.47.
Technical Scenarios
Bullish Scenario
For a bullish recovery to develop from current levels, price must first reclaim the $100.00 psychological level and clear resistance at $108.60. A sustained move above $108.60 accompanied by momentum rising back above the zero line would be required to neutralize the current bearish trend.
Bearish Scenario
If selling pressure continues and price fails to hold the current $89.00 support area, the stock risks further downside toward lower historical support zones visible near $70.00 and $60.00. Continued lower highs and lower lows would reinforce the ongoing downwave.
Neutral / Range Scenario
Price may consolidate between $85.00 and $100.00, allowing the heavily oversold momentum indicator to normalize back toward zero without generating a strong trend in either direction.
Risk and Invalidation
The structural invalidation of the original Hidden Bullish Double Divergence setup occurred the moment price closed beneath the July swing low anchor of $108.60. In technical analysis, once the price level that anchors a divergence signal breaks, the signal is officially invalidated and must be discarded.
Key Levels Summary
| Level / Zone | Role | Technical Significance |
| $130.00 – $135.00 | Major Resistance | Multi-month peak and double-top rejection area. |
| $108.60 – $110.00 | Key Breakdown / Resistance | Anchor point “H” for the failed Hidden Bullish Double Divergence. |
| $100.00 | Intermediate Resistance | Early June swing low, now overhead resistance. |
| $89.00 – $89.47 | Current Support | Latest daily swing low and current price location. |
Technical Outlook
The daily chart for INTC serves as a textbook example of signal failure. While the Momentum2DIVpro indicator accurately identified a multi-point Hidden Bullish Double Divergence structure at $108.60, the underlying market context—marked by severe selling momentum and a lack of price confirmation—overwhelmed the bullish setup. The current technical outlook remains bearish to neutral until price can reclaim key broken support levels above $108.60.
Educational Conclusion
The primary lesson from this chart is that divergence is a condition, not a trigger. Even multi-point indicators like Double Divergence, which filter out significant market noise, cannot guarantee a trend continuation or reversal on their own. Traders must always wait for price confirmation—such as support holding or key structural resistance breaking—before acting on an indicator signal. When price action directly contradicts an indicator setup by breaking key structural levels, the price action must always take precedence.
Frequently Asked Questions
1. What is a Hidden Bullish Double Divergence? A Hidden Bullish Double Divergence occurs when price forms higher swing lows relative to two prior historical points, while a momentum indicator forms lower troughs across those same points. It typically signals that the broader uptrend is ready to resume after a pullback.
2. Why did the Double Divergence signal on INTC fail? The signal failed because the severe drop in price momentum created overwhelming selling pressure, and buyers failed to produce any bullish confirmation candles at the $108.60 support level. Price ultimately broke down through support, invalidating the pattern.
3. How do you confirm a Double Divergence signal before trading? Confirmation requires waiting for price action to validate the indicator. This can include bullish reversal candlestick patterns, a break above short-term resistance, or momentum crossing back above its baseline.
4. What level invalidated the bullish technical setup on this chart? The setup was officially invalidated when price closed below $108.60, breaking the higher-low price sequence required to maintain a hidden bullish divergence structure.
Looking for the complete mathematical breakdown, step-by-step optimization guides, and advanced trading strategies? Explore our comprehensive documentation:
Visit the Technical Inputs Manual: Double Divergence Pro for full parameter tuning.
Read the master guide on the Double Divergence Indicator Series.