Amazon (AMZN) Daily Chart Technical Analysis: Evaluating Momentum and Hidden Bullish Double Divergence
Market Overview
The daily candlestick chart for Amazon.com, Inc. (AMZN) reveals a dynamic shifting market structure across a multi-month period from February through September. The stock experienced a strong expansion phase starting in late March, propelling price into a prominent peak near $275.00 in early May. Following this high, AMZN transitioned into a multi-phase corrective downtrend, forming lower highs and lower lows through late June.
In July and August, price established a crucial swing support area near $225.00–$228.00 before experiencing a major upside gap that carried the stock back above $270.00. Subsequent price action shows a gradual drift lower, settling back into the $250.00–$255.00 zone by September. Understanding this overarching structure provides essential context for evaluating the momentum signals generated during the consolidation phase.
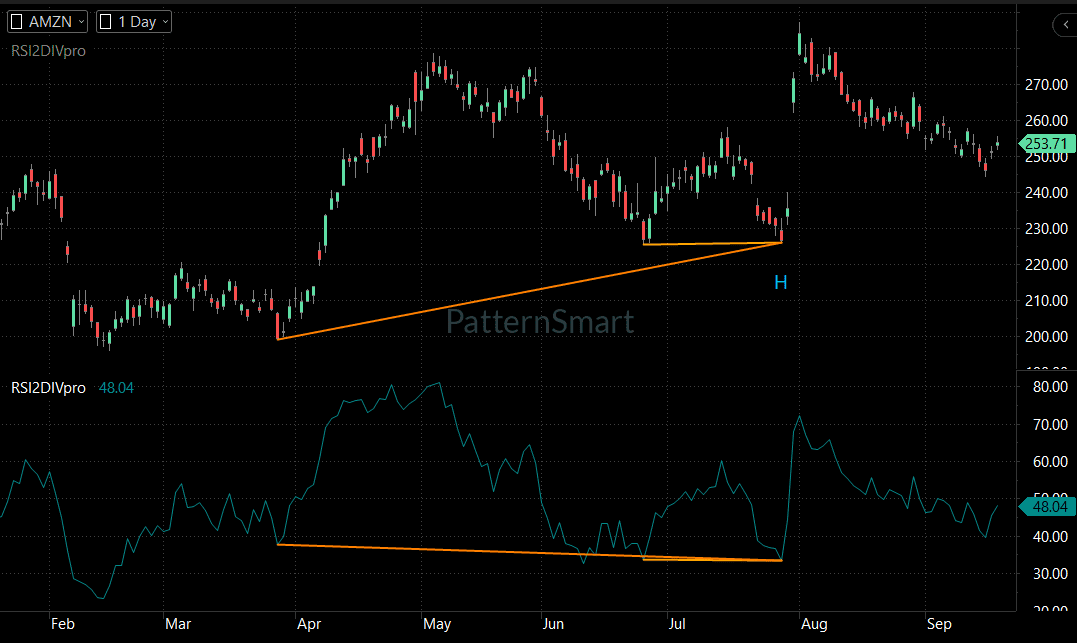
Chart Setup
- Instrument: Amazon.com, Inc.
- Symbol: AMZN
- Timeframe: Daily (1 Day)
- Chart Type: Candlestick Price Chart
- Primary Indicator: RSI Double Divergence (
RSI2DIVpro, currently reading 48.04)
Price Action Analysis
Price action on the AMZN daily chart reflects several distinct structural phases:
- Base Building & Impulse (Feb–May): After consolidating around the $200.00–$210.00 area in February and March, AMZN launched a powerful impulsive advance, creating a higher high near $275.00.
- Corrective Pullback (May–July): The advance encountered resistance, leading to a prolonged distribution and corrective decline toward the $230.00 level in June. A minor rebound in early July failed to sustain higher levels, resulting in a retest of the baseline support zone near $225.00–$228.00 in late July.
- Support Defense & Gap-Up (Late July–August): At the second retest of the $225.00–$228.00 floor, price formed a double-bottom structure marked by an orange support line and labeled with a blue “H” signal marker. Buyers aggressively defended this zone, leading to a massive bullish price gap back toward $275.00.
- Current Drift (August–September): Following the gap, price has retraced lower in a controlled, declining channel, currently stabilizing around $253.71.
Trend Analysis
The broader market structure exhibits a transition from an aggressive bull trend to a complex range-bound consolidation:
- Primary Trend: The broader structural movement from March ($200.00 base) to August remains structurally bullish, characterized by net higher lows on the macro scale.
- Intermediate Trend: The corrective phase from May to July established a temporary downtrend. However, the failure of sellers to breakdown below the $225.00 horizontal structural support maintained the broader bullish market frame.
- Current Short-Term Trend: Following the explosive gap-up in early August, short-term price action has drifted downward into a pull-back phase, currently testing the midpoint of the larger trading range near $253.00.
Key Support and Resistance Levels
Identifying horizontal price boundaries helps define the logical framework for future price expansion or breakdown:
- Major Overhead Resistance ($270.00 – $275.00): Represents the major multi-peak swing highs from early May and the post-gap peak in early August. A sustained close above this zone would be required to signal major bullish trend continuation.
- Intermediate Support / Resistance ($250.00 – $253.70): The current price level acts as a midpoint pivot, reflecting recent consolidation during late August and September.
- Major Horizontal Structural Support ($225.00 – $228.00): The critical multi-touch demand floor highlighted by the orange support horizontal line. This zone served as the springboard for the violent early August gap-up.
- Macro Baseline Support ($200.00 – $202.00): The structural swing low established in late March, acting as the origin of the broader bullish move.
Momentum Analysis
The lower indicator panel displays the RSI2DIVpro oscillator (currently printed at 48.04). Measuring momentum alongside price structure highlights key shifts in buying and selling pressure:
- Oscillator Peak Expansion: During the explosive March–April rally, RSI surged above 80.00, confirming strong upside momentum.
- Subsequent Momentum Decline: As price corrected from May through July, momentum pulled back below the 50.00 midpoint, hovering near 35.00–40.00.
- Divergent Behavior: While price defended a significantly higher structural low in July ($225.00–$228.00) relative to its late-March low ($200.00), the momentum indicator printed lower relative troughs across those reference points, creating a distinct multi-point divergence line drawn across the indicator panel.
RSI Double Divergence Analysis
The chart features a clear Hidden Bullish Double Divergence signal, identified on the price panel by the orange trend lines and the blue “H” indicator designation below the July price trough.
Signal Breakdown: Hidden Bullish Double Divergence (“H”)
- Where It Appears: The signal forms across three structural swing points spanning late March, late June, and late July, culminating at the $225.00–$228.00 price trough labeled “H”.
- Price Action Movement: Price held a clear higher low (and a near-equal horizontal support relative to June) at $225.00–$228.00 compared to the significant baseline swing low near $200.00 in late March. The orange line connecting the late March price low to the late July price low slopes upward, demonstrating preserved structural price support.
- Indicator Movement: Conversely, the
RSI2DIVproindicator printed a lower trough across these historical reference points. The orange line on the subchart indicator slopes downward from the late March baseline momentum level to the late July momentum low (hovering near 35.00). - Signal Classification: This combination—price holding higher structural lows while momentum forms lower troughs—defines a Hidden Bullish Double Divergence.
- Contextual Meaning: In market structure, Hidden Bullish Double Divergence signifies underlying bull-market strength during a corrective pullback. Even though indicator momentum dropped significantly due to prolonged selling pressure, price structural integrity refused to yield new lows. This reveals that sellers lacked the supply needed to push price deeper, indicating that underlying buyers were quietly absorbing supply.
- Subsequent Price Action: Following the appearance of the “H” signal at the end of July, price experienced an immediate, powerful bullish response. A massive upside gap propelled AMZN from below $230.00 to over $270.00 within a few trading sessions, successfully confirming the continuation signal.
Price Confirmation vs. Indicator Signal
It is critical to distinguish between the generation of an indicator signal and subsequent price confirmation:
- The Signal: The Hidden Bullish Double Divergence signal (“H”) alerted traders to momentum exhaustion relative to price structure as price tested $225.00 in late July.
- The Confirmation: The signal was formally confirmed when price responded with an aggressive bullish rejection off the $225.00 support level, culminating in a gap-up break above intermediate structural resistance ($240.00–$250.00). Without subsequent buying volume and price expansion, divergence signals remain conditional hypothesis markers rather than executed trade setups.
Technical Scenarios
Bullish Scenario
If price holds above the current $250.00 pivot zone, buyers could attempt to retest the major resistance band at $270.00–$275.00. A decisive breakout and daily close above $275.00 would open the path toward new structural highs, reaffirming the macro uptrend initiated by the Hidden Double Divergence signal.
Bearish Scenario
If selling pressure increases and price breaks below the $250.00 level, AMZN could slide back toward the major demand floor at $225.00–$228.00. A sustained breakdown below $225.00 would signal severe structural damage, increasing the risk of a deeper decline toward the $200.00 macro support baseline.
Neutral / Range Scenario
Price may continue to consolidate between $250.00 and $265.00, allowing the RSI oscillator (currently at 48.04) to normalize around its 50.00 baseline while the market digests the August gap-up move.
Risk and Invalidation
- Signal Invalidation Level: The structural invalidation point for the Hidden Bullish Double Divergence setup sits directly below the key horizontal swing low at $225.00.
- Structural Invalidation: A daily close below $225.00 would invalidate the higher-low structural integrity of the chart, proving that the bullish continuation thesis had failed and that sellers had regained control over the medium-term trend.
Key Levels Summary
| Level / Zone | Role | Technical Significance |
| $270.00 – $275.00 | Major Resistance | Multi-peak swing highs (May & August gap peak). |
| $250.00 – $253.71 | Pivot / Intermediate Support | Current trading zone and mid-range structural floor. |
| $225.00 – $228.00 | Major Structural Support | Location of “H” signal; double-bottom demand base. |
| $200.00 – $202.00 | Macro Support / Invalidation Base | March base low; primary origin of macro trend. |
Technical Outlook
Amazon (AMZN) displays a technically healthy long-term structural framework. The emergence of a Hidden Bullish Double Divergence (“H”) in late July highlighted a classic momentum-versus-price imbalance, where price held structural support despite deep oscillator pullbacks. The subsequent gap-up into the $270.00 range confirmed the strength of this signal. While short-term price action has pulled back to $253.71, the broader bullish posture remains intact as long as price respects the $225.00 macro support boundary.
Educational Conclusion
This AMZN daily chart provides a textbook lesson on the application of Hidden Double Divergence:
- Structure Dominates Momentum: Standard indicators can often hit oversold extremes during pullbacks, giving a false impression of weakness. Hidden divergence teaches us to prioritize price structure (higher lows) over raw indicator depth.
- Multi-Point Reference Mitigates Noise: By cross-referencing two distinct historical reference points (late March and late June/July), the Double Divergence framework filters out singular swing anomalies, providing higher-confidence context.
- Always Wait for Confirmation: A divergence signal highlights potential opportunity; actual trade edge comes from seeing price confirm the signal via support defense, candlestick confirmation, or structural breakouts.
Looking for the complete mathematical breakdown, step-by-step optimization guides, and advanced trading strategies? Explore our comprehensive documentation:
Visit the Technical Inputs Manual: Double Divergence Pro for full parameter tuning.
Read the master guide on the Double Divergence Indicator Series.
Frequently Asked Questions
What does the blue “H” on the AMZN chart stand for?
The “H” symbol denotes a Hidden Bullish Double Divergence signal. It flags a condition where price holds a higher low relative to previous historical swing lows while the momentum indicator prints lower troughs, signaling underlying trend continuation strength.
How did the RSI Double Divergence perform on this chart?
The Hidden Double Divergence signal in late July performed with high accuracy. Following its appearance at the $225.00 structural support floor, price rapidly responded with a bullish rally and gap-up back above $270.00.
What is the difference between Regular and Hidden Double Divergence?
Regular Double Divergence signals potential trend reversals (e.g., price makes higher highs, but indicator makes lower highs). Hidden Double Divergence signals potential trend continuation following pullbacks (e.g., price holds higher lows, but indicator makes deeper lower lows).
What key price level invalidates the current bullish structure on AMZN?
A daily closing price below the major horizontal support zone at $225.00 would invalidate the higher-low market structure established by the late July divergence setup.