EUR/CAD 5-Minute Technical Analysis: Evaluating Intraday Price Structure and Stochastics Double Divergence
Market Overview
The 5-minute Heikin-Ashi chart for the EUR/CAD currency pair illustrates a complete intraday market cycle. The session displays a distinct transition: an initial push to a session high, a sustained multi-hour downtrend, a sharp bottoming V-shaped reversal, and a subsequent recovery that established a steady uptrend.
Throughout this sequence, price action interacted with the subchart indicator panel displaying the Stochastics2DIVpro oscillator (currently reading 84.29 / 82.58 in overbought territory). The chart features four distinct Double Divergence signals that marked major inflection points along the way: a top reversal, a bearish continuation during the decline, a bottom reversal, and a bullish continuation during the recovery phase.
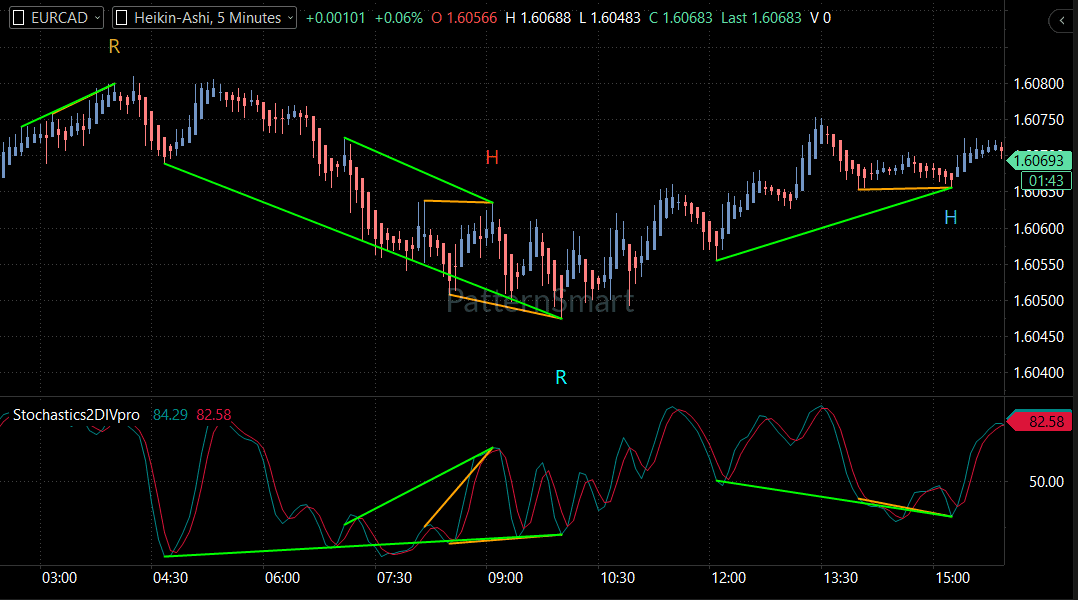
Chart Setup
- Instrument: Euro / Canadian Dollar
- Symbol: EUR/CAD
- Timeframe: 5 Minutes (5 Min)
- Chart Type: Heikin-Ashi Candlestick Price Chart
- Primary Indicator: Stochastics Double Divergence (
Stochastics2DIVpro, currently reading %K 84.29, %D 82.58) - Current Market Quote: Open 1.60566, High 1.60688, Low 1.60483, Close 1.60683, Last 1.60693
Price Action Analysis
The 5-minute Heikin-Ashi price action across the session reveals four primary structural phases:
- Session High & Early Exhaustion (03:00 – 04:30): EUR/CAD pushed higher in a series of green Heikin-Ashi candles, reaching a peak above 1.60800 around 04:00 before stalling into consolidation.
- Impulsive Downtrend (04:30 – 10:00): Selling pressure accelerated, breaking local swing support. Price established a clean sequence of lower highs and lower lows, descending toward a daily session low below 1.60500 around 10:00.
- V-Bottom Reversal & Initial Bounce (10:00 – 12:00): After printing a final trough below 1.60500, price reacted with strong bullish candles, quickly reclaiming the 1.60600 area and transitioning into a new structural sequence.
- Ascending Recovery & Consolidation (12:00 – 15:30): The pair built a steady higher-high, higher-low pattern, advancing toward 1.60750 before entering a mild higher-low consolidation around 1.60650–1.60693.
Trend Analysis
- Prior Trend: Intraday Bearish (04:30 – 10:00). Defined by a downward slope with lower swing peaks and declining troughs.
- Trend Transition: Occurred between 10:00 and 10:30 following a multi-point momentum exhaustion signal at the 1.60483 area.
- Current Trend: Intraday Bullish. The 5-minute chart exhibits a series of higher swing lows (connected by green trendlines) and higher swing highs, currently holding near 1.60693.
Key Support and Resistance Levels
Key intraday boundaries visible on the 5-minute scale include:
- Session Resistance ($1.60800 – $1.60850): The prominent session peak established around 04:00.
- Intermediate Resistance ($1.60750): The high of the post-10:00 recovery rally formed around 13:00.
- Pivot / Intermediate Support ($1.60630 – $1.60650): The recent consolidation floor where the latest Hidden Bullish Double Divergence (“H”) signal was generated.
- Session Structural Support ($1.60480 – $1.60500): The absolute session floor established at 10:00, representing the launch point of the current intraday uptrend.
Momentum Analysis
The lower indicator panel displays the Stochastics2DIVpro oscillator, currently reading 84.29 / 82.58:
- Cyclical Oscillations: The Stochastic lines moved rapidly between oversold (<20.00) and overbought (>80.00) zones throughout the session, matching the swing structure of the 5-minute price bars.
- Multi-Point Divergence Patterns: Because standard single-swing Stochastic crossovers can generate frequent false signals during strong intraday trends, the Double Divergence framework filters signals by requiring a three-point structural alignment across historical swing points.
Signal-by-Signal Double Divergence Analysis
The chart features four separate Double Divergence signals labeled with yellow “R”, orange “H”, cyan “R”, and cyan “H”.
                    ┌─────────────────────────────────────────┐
                    │      EURCAD DOUBLE DIVERGENCE SIGNALS   │
                    └────────────────────┬────────────────────┘
                                         │
        ┌───────────────────┬────────────┴──────────────┬───────────────────┐
        ▼                   ▼                           ▼                   ▼
┌───────────────┐   ┌───────────────┐           ┌───────────────┐   ┌───────────────┐
│  Signal #1    │   │  Signal #2    │           │  Signal #3    │   │  Signal #4    │
│Regular Bearish│   │Hidden Bearish │           │Regular Bullish│   │Hidden Bullish │
│      "R"      │   │      "H"      │           │      "R"      │   │      "H"      │
│  (Reversal)   │   │(Continuation) │           │  (Reversal)   │   │(Continuation) │
└───────────────┘   └───────────────┘           └───────────────┘   └───────────────┘
Signal #1: Regular Bearish Double Divergence (“R”) — Early Session Peak
- Divergence Type: Regular Bearish Double Divergence (“R”).
- Expected Market Behavior: Potential trend reversal from bullish to bearish due to buying exhaustion.
- Where It Appears: Located at the top left of the chart around 04:00, marked by a yellow “R” above the price peak.
- Price Movement: Price made higher highs up to the 1.60800 level (connected by the green line sloping upward across price tops).
- Indicator Movement: The Stochastic subchart panel failed to confirm these higher price highs, printing lower momentum peaks across the reference points (sloping downward).
- Context & Confirmation: This signal indicated that despite higher price quotes, buying velocity was drying up. Price confirmed the signal shortly after by breaking below local swing support around 1.60750, initiating the multi-hour sell-off toward 1.60500.
- Actual Market Behavior: Successful bearish reversal.
Signal #2: Hidden Bearish Double Divergence (“H”) — Mid-Downtrend Continuation
- Divergence Type: Hidden Bearish Double Divergence (“H”).
- Expected Market Behavior: Potential bearish trend continuation following a relief rally/pullback within an established downtrend.
- Where It Appears: Located around 08:30–09:00 during a mid-session pullback, labeled with an orange “H” above the price structure.
- Price Movement: Price held a lower high (connected by the green trendline sloping downward across price highs, and an orange line across local reaction peaks near 1.60650) relative to previous swing highs, preserving the lower-high downtrend structure.
- Indicator Movement: The Stochastic lines pushed significantly higher, printing higher momentum peaks across both reference points (connected by the green and orange lines sloping sharply upward in the subchart).
- Context & Confirmation: This combination (price holding a lower high while momentum makes a higher high) indicates that despite a strong surge in oscillator momentum, buyers were unable to lift price above overhead resistance. The signal was confirmed as price resumed its decline, breaking to new session lows below 1.60500.
- Actual Market Behavior: Successful bearish continuation.
Signal #3: Regular Bullish Double Divergence (“R”) — Session Floor Reversal
- Divergence Type: Regular Bullish Double Divergence (labeled with a cyan “R” marker beneath the subchart at 10:00).
- Expected Market Behavior: Potential major trend reversal from bearish to bullish due to downward selling exhaustion.
- Where It Appears: Formed across the major downtrend troughs between 04:30 and 10:00, culminating at the session low near 1.60483.
- Price Movement: Price made three progressively lower lows (connected by the green and orange downward-sloping trendlines under the price candles).
- Indicator Movement: The Stochastic oscillator failed to confirm the new price lows, forming higher troughs across those same reference points (connected by the green and orange lines sloping upward from 04:30 to 10:00 near the subchart floor).
- Context & Confirmation: This multi-point alignment signaled that selling velocity had been exhausted despite lower price prints. The signal was confirmed as price staged a sharp V-bottom rejection off 1.60483, breaking back above intermediate resistance at 1.60600.
- Actual Market Behavior: Successful bullish reversal.
Signal #4: Hidden Bullish Double Divergence (“H”) — Recovery Continuation
- Divergence Type: Hidden Bullish Double Divergence (“H”).
- Expected Market Behavior: Potential bullish trend continuation following a shallow pullback in an established uptrend.
- Where It Appears: Located near the end of the chart around 14:00–15:00, marked by a cyan “H” below the price consolidation.
- Price Movement: Price held a higher low near 1.60630–1.60650 relative to the 12:00 swing low (~1.60550), as shown by the ascending green line and orange support boundary.
- Indicator Movement: The Stochastic subchart panel printed lower troughs across the corresponding points (connected by the descending green and orange lines), dipping deeper than price movement suggested.
- Context & Confirmation: This pattern shows that sellers pushed oscillator momentum down significantly, yet price held firm above structural support. Confirmation is visible in the final candles, where price bounced off the orange support line toward 1.60693 with Stochastics surging back into overbought territory (84.29 / 82.58).
- Actual Market Behavior: Successful bullish continuation.
Price Confirmation vs. Indicator Signal
Across all four examples on this 5-minute chart, a clear boundary exists between signal setup and price action confirmation:
- Indicator Signal Setup: The Double Divergence indicator flags conditions where momentum and price structure diverge across multi-point swing alignments.
- Price Action Confirmation: Signal execution relies on price confirming the thesis—such as breaking local swing highs/lows or forming strong rejection candles off trendlines. Without price confirmation, intraday momentum can remain stretched.
Technical Scenarios
                       ┌─────────────────────────────────────────┐
                       │       EURCAD CONDITIONAL SCENARIOS      │
                       └────────────────────┬────────────────────┘
                                            │
        ┌───────────────────────────────────┼───────────────────────────────────┐
        ▼                                   ▼                                   ▼
┌───────────────┐                   ┌───────────────┐                   ┌───────────────┐
│Bullish Scenario│                   │Bearish Scenario│                   │Neutral Scenario│
├───────────────┤                   ├───────────────┤                   ├───────────────┤
│• Hold > 1.6065│                   │• Break < 1.606│                   │• Range 1.6063 │
│• Break > 1.607│                   │• Test 1.6055  │                   │  to 1.6075    │
│• Target 1.6080│                   │• Target 1.6048│                   │• Stochastics  │
│  Session High │                   │  Session Low  │                   │  Normalizes   │
└───────────────┘                   └───────────────┘                   └───────────────┘
Bullish Scenario
If price maintains its footing above the immediate pivot support at $1.60630–$1.60650 (the base of the recent “H” signal), buyers could drive a retest of $1.60750. A breakout above $1.60750 would target the major session high at $1.60800–$1.60850.
Bearish Scenario
If sellers push price below $1.60630, it would invalidate the recent Hidden Bullish Continuation setup, opening downside risk toward $1.60550. A sustained breakdown below $1.60550 would re-open the path toward the major floor at $1.60483.
Neutral / Range Scenario
Given the current high Stochastic reading (84.29 / 82.58), price may trade sideways between $1.60630 and $1.60750, allowing the oscillator to cool off before the next intraday leg.
Risk and Invalidation
- Bullish Continuation Invalidation: A 5-minute close below 1.60630 invalidates the latest Hidden Bullish Double Divergence (“H”) setup.
- Macro Reversal Invalidation: A breakdown below the session support floor at 1.60483 would fully invalidate the intraday recovery structure.
Key Levels Summary
| Level / Zone | Role | Technical Significance |
| 1.60800 – 1.60850 | Major Session Resistance | Session high; origin of early Regular Bearish Divergence (“R”). |
| 1.60750 | Intermediate Resistance | Peak of post-reversal rally around 13:00. |
| 1.60683 – 1.60693 | Current Quote / Pivot | Active 5-minute price level ($1.60693). |
| 1.60630 – 1.60650 | Immediate Support Floor | Location of current Hidden Bullish Divergence (“H”) signal. |
| 1.60480 – 1.60500 | Major Structural Support | Session low; origin of Regular Bullish Reversal (“R”). |
Technical Outlook
The EUR/CAD 5-minute chart provides a clear overview of intraday market mechanics. The session transitioned from an early top marked by Regular Bearish Double Divergence (“R”) into a sustained downtrend reinforced by Hidden Bearish Double Divergence (“H”). The downtrend exhausted at 1.60483 under a Regular Bullish Double Divergence (“R”) reversal signal.
Currently, price is respecting a Hidden Bullish Double Divergence (“H”) continuation structure near 1.60630–1.60693. As long as price remains above 1.60630, the short-term intraday bias remains tilted toward the upside.
Educational Conclusion
This EUR/CAD chart demonstrates key technical principles for intraday trading:
- Reversal vs. Continuation Roles: Regular Double Divergence (“R”) identifies trend exhaustion and potential turning points, whereas Hidden Double Divergence (“H”) identifies high-probability continuation pullbacks within existing trends.
- Multi-Point Filtering on Short Timeframes: On fast timeframes like the 5-minute chart, standard indicators generate noise. Requiring a three-point structural alignment filters out low-quality crossovers.
- Price Context Prevails: An indicator signal serves as a technical alert. Real edge comes from confirming the signal against price structure, trendlines, and support/resistance levels.
Frequently Asked Questions
What do the “R” and “H” labels represent on the EUR/CAD chart?
“R” stands for Regular Double Divergence (indicating potential trend reversals due to exhaustion), while “H” stands for Hidden Double Divergence (indicating potential trend continuation after pullbacks).
How did the Regular Bullish Double Divergence at 10:00 perform?
It performed effectively. After printing at the session low near 1.60483, price made an immediate V-shaped reversal, rallying over 25 pips toward 1.60750.
What is the current short-term trend for EUR/CAD on this chart?
The current short-term trend is intraday bullish, holding higher lows above 1.60630 following the 10:00 bottom reversal and the subsequent 14:00 Hidden Bullish continuation signal.
What level invalidates the active bullish continuation setup?
A 5-minute close below the immediate support floor at 1.60630 would invalidate the latest Hidden Bullish Double Divergence signal.
Looking for the complete mathematical breakdown, step-by-step optimization guides, and advanced trading strategies? Explore our comprehensive documentation:
Visit the Technical Inputs Manual: Double Divergence Pro for full parameter tuning.
Read the master guide on the Double Divergence Indicator Series.