Automatically Detect High-Probability Double Bottom Reversal Patterns
Chart Pattern Double Bottom for cTrader is a professional technical analysis indicator designed to automatically identify and highlight Double Bottom chart formations directly on your cTrader charts. Built for traders who want to recognize potential bullish reversal opportunities without manually scanning price action, this indicator helps simplify pattern recognition and improve market analysis efficiency.
The Double Bottom is one of the most widely recognized bullish reversal patterns in technical analysis. It often appears after a downward trend and can signal a potential shift in market direction. This indicator continuously monitors market structure and automatically marks detected patterns, allowing traders to focus on decision-making rather than manual chart analysis.
Key Features
Automatic Double Bottom Detection
The indicator scans price action in real time and automatically identifies valid Double Bottom formations as they develop.
Multiple Pattern Size Support
Adapt the indicator to different trading styles with built-in support for:
- Small patterns
- Medium patterns
- Large patterns
This flexibility allows traders to identify opportunities across various market conditions and timeframes.
Clear Visual Chart Marking
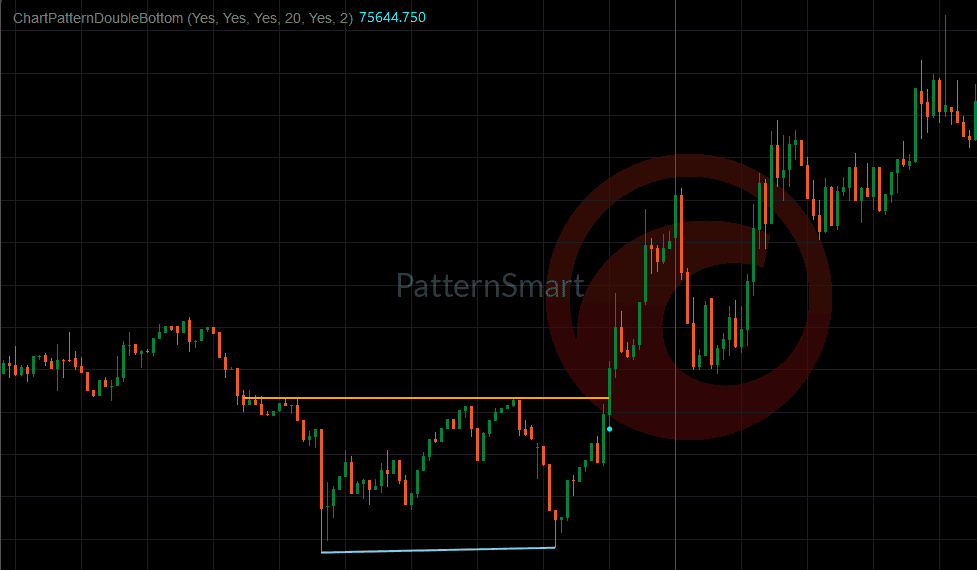
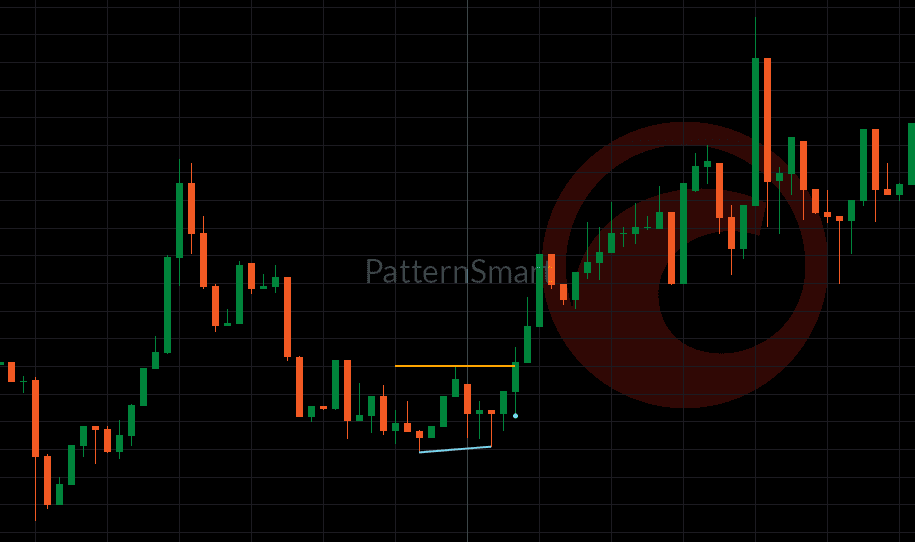
When a pattern is detected, the indicator draws:
- A bottom connection line between the two significant lows
- A resistance breakout level for easy visualization
- Visual markers directly on the chart
The result is a clean and intuitive presentation of the pattern structure.
Real-Time Alerts
Stay informed without constantly watching the screen.
Features include:
- Pop-up notifications
- Sound alerts
- Immediate pattern detection updates
Alerts help traders react quickly when new opportunities emerge.
Customizable Appearance
Match the indicator to your trading workspace with adjustable:
- Line colors
- Line thickness
- Alert settings
- Pattern size filters
Works on Any Market
The indicator can be used on:
- Forex
- Indices
- Commodities
- Cryptocurrencies
- Stocks
- CFDs

Benefits for Traders
Save Time
Eliminate the need to manually search for Double Bottom formations across multiple charts and timeframes.
Improve Chart Analysis
Receive objective pattern identification based on price structure rather than subjective visual interpretation.
Enhance Trade Preparation
Quickly identify potential reversal zones and important breakout areas for further confirmation using your preferred trading strategy.
Suitable for All Experience Levels
Whether you are a beginner learning chart patterns or an experienced technical analyst, the indicator provides an easy-to-understand visual representation of market structure.

Common Trading Applications
Traders often use Double Bottom formations to:
- Identify potential trend reversals
- Monitor bullish breakout opportunities
- Confirm support zone strength
- Improve technical analysis workflows
- Combine with other indicators such as moving averages, volume analysis, and momentum tools
Customization Options
The indicator includes configurable settings for:
- Pattern size selection
- Detection sensitivity range
- Alert activation
- Alert sound selection
- Pattern visualization colors
- Line width adjustments
These options allow traders to tailor the indicator to their individual trading preferences.
Why Choose Chart Pattern Double Bottom for cTrader?
Manually identifying chart patterns can be time-consuming and inconsistent. Chart Pattern Double Bottom for cTrader automates the process by continuously scanning the market and highlighting potential reversal formations as they appear. By providing instant visual recognition and configurable alerts, the indicator helps traders analyze markets more efficiently and focus on high-quality trading opportunities.
Compatibility
- Platform: cTrader
- Asset Types: Forex, Stocks, Indices, Commodities, Cryptocurrencies, CFDs
- Timeframes: Compatible with all chart timeframes
- Interface: Fully integrated into cTrader charts
Conclusion
Chart Pattern Double Bottom for cTrader is a powerful pattern recognition tool that helps traders quickly identify bullish Double Bottom formations, monitor potential trend reversals, and improve chart analysis efficiency. With automatic detection, customizable settings, real-time alerts, and clear chart visualization, it is a valuable addition to any technical trader’s toolbox.
Get the Chart Pattern Double Bottom Indicator for cTrader and enhance your technical analysis workflow.