Product Overview
Identify and visualize Broadening Formation chart patterns automatically with the Chart Pattern Broadening Formation Indicator for cTrader. Designed for traders who rely on technical analysis and price action, this indicator helps identify expanding price structures where successive swing highs move higher while successive swing lows move lower.
A Broadening Formation, also known as an Expanding Formation or Megaphone Pattern, is a technical chart pattern characterized by widening price movements. It reflects increasing market volatility and expanding price ranges, potentially signaling uncertainty, conflicting market sentiment, or an important period of price discovery.
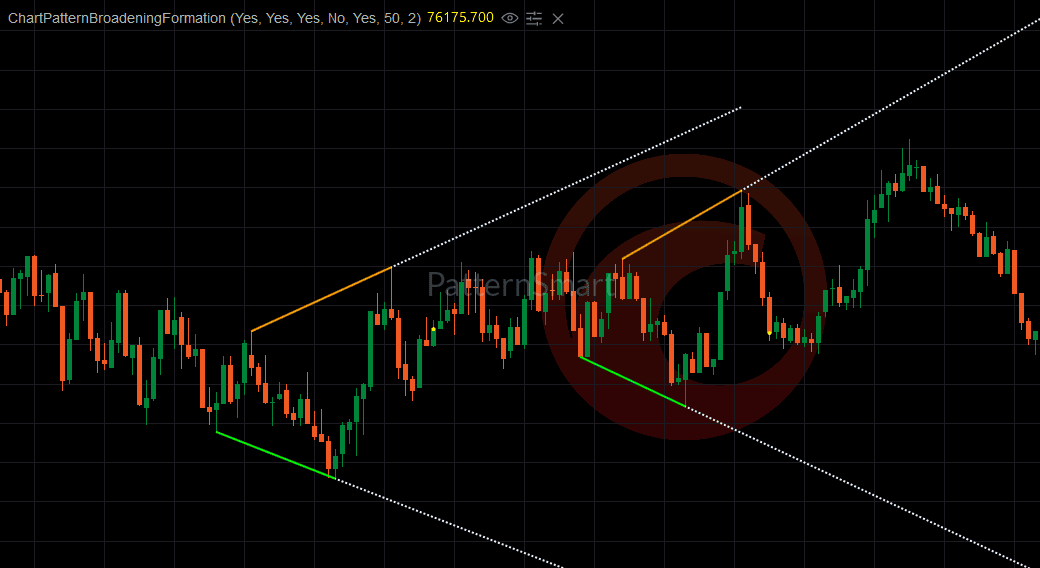
Instead of manually searching through historical price movements for this complex chart structure, the Chart Pattern Broadening Formation Indicator continuously monitors market data and automatically identifies qualifying formations. Once detected, it draws the corresponding upper and lower trendlines directly on the chart, making the pattern easier to recognize, analyze, and monitor.
With support for small, medium, and large pattern configurations, customizable chart displays, projected trendline extensions, and sound notifications, this indicator provides a practical tool for incorporating Broadening Formation analysis into your cTrader trading workflow.

Key Features
1. Automatic Broadening Formation Detection
The indicator automatically scans price action to identify potential Broadening Formation patterns.
It looks for the characteristic expanding structure in which:
- Successive swing highs establish higher price levels.
- Successive swing lows establish lower price levels.
- The distance between the upper and lower boundaries expands.
- Both boundaries develop outward-sloping trendlines.
- Price movements form a recognizable expanding structure.
When a qualifying formation is identified, the indicator automatically displays it on the chart.
This saves time compared with manually identifying swing points and drawing trendlines while helping traders discover potential formations across different market conditions.
2. Multiple Pattern Sizes
Different traders focus on different levels of market structure. Some prefer short-term formations, while others concentrate on larger patterns that develop over extended periods.
The indicator supports three pattern-size configurations:
- Small Pattern: Helps identify smaller formations and shorter-term expanding price structures.
- Medium Pattern: Provides a medium-scale perspective for analyzing developing market structures.
- Large Pattern: Helps identify larger formations that develop across broader price movements.
Each pattern size can be independently enabled or disabled.
This flexibility allows traders to focus on the formations most relevant to their trading style without requiring separate indicators.

3. Automatic Upper and Lower Trendlines
Once a Broadening Formation is detected, the indicator automatically draws two important boundary lines:
Upper Trendline
Connects the relevant swing highs and illustrates the upward-expanding upper boundary of the formation.
Lower Trendline
Connects the relevant swing lows and illustrates the downward-expanding lower boundary.
Together, these lines create the characteristic expanding structure of a Broadening Formation.
The two trendlines help traders visually evaluate the development of the formation, understand its boundaries, and monitor subsequent price movements.
4. Projected Trendline Extensions
Understanding where a formation’s boundaries may extend can help traders monitor future price action.
The indicator supports projected extensions for both upper and lower trendlines.
These extension lines are displayed using a dotted line style, visually distinguishing projected boundaries from the original pattern trendlines.
The number of extension bars is customizable, allowing traders to determine how far the trendlines should extend into future chart space.
This feature provides a useful visual reference when monitoring how price behaves relative to the expanding structure.
5. Display the Latest Pattern Only
When analyzing multiple historical formations, chart clarity becomes important.
The indicator includes a Show Last Pattern Only option.
When enabled, the indicator focuses the chart display on the latest detected Broadening Formation rather than retaining multiple historical pattern drawings.
When disabled, previously identified formations can remain visible, allowing traders to review historical patterns and compare their structures.
This feature is particularly useful for traders who want either a clean chart for current analysis or a broader historical perspective.
6. Sound Alerts for New Pattern Detection
Monitoring charts continuously is not always practical.
The indicator includes an optional sound notification feature that can alert traders when a new Broadening Formation is detected.
When enabled, the indicator plays the configured sound file when a qualifying pattern is identified on the latest chart bar.
The sound alert helps traders become aware of newly detected formations without having to watch the chart continuously.
The notification feature can be enabled or disabled according to individual preferences.
7. Fully Customizable Chart Appearance
The indicator provides several visual customization options to help traders integrate pattern detection into their existing chart layouts.
Available display settings include:
- Upper Line Color: Customize the color of the upper trendline.
- Lower Line Color: Customize the color of the lower trendline.
- Extension Line Color: Customize the color of projected trendline extensions.
- Line Width: Adjust the thickness of the displayed trendlines.
- Extension Bars: Control the projection distance of the extension lines.
These settings allow traders to create a chart presentation that matches their preferred visual style and makes pattern boundaries easy to distinguish.
Understanding the Broadening Formation Pattern
A Broadening Formation is a technical analysis pattern in which price action develops an expanding range, with successive highs reaching higher levels and successive lows reaching lower levels.
Unlike traditional consolidation patterns, where price movements become increasingly compressed, a Broadening Formation demonstrates expanding volatility.
The expanding structure can provide useful information about market behavior.
Some common characteristics include:
Expanding Price Range
The distance between successive highs and lows increases, indicating that the market is experiencing wider price fluctuations.
Increasing Market Volatility
The expanding boundaries may reflect stronger disagreement between buyers and sellers, resulting in increasingly wide price swings.
Important Technical Boundaries
The upper and lower trendlines provide reference levels for observing how price interacts with the formation.
Potential Breakout Opportunities
A decisive move beyond one of the formation’s boundaries may attract traders looking for potential breakout opportunities. However, a breakout should be evaluated using additional price-action and market-context confirmation.
How to Use the Indicator
The Chart Pattern Broadening Formation Indicator is designed to simplify the process of identifying and monitoring expanding chart structures.
A typical analysis workflow may include the following steps:
Step 1: Add the Indicator to Your cTrader Chart
Apply the indicator to your preferred trading instrument and timeframe.
Step 2: Configure Pattern Sizes
Enable or disable Small, Medium, and Large Pattern detection according to your trading objectives.
Step 3: Review Automatically Detected Formations
When a qualifying Broadening Formation is identified, the indicator draws the upper and lower trendlines directly on the chart.
Step 4: Analyze the Expanding Structure
Observe the relationship between the upper and lower boundaries, the width of the formation, and the surrounding price action.
Step 5: Monitor Projected Boundaries
Enable trendline extensions to monitor how future price movements relate to the projected boundaries.
Step 6: Evaluate Potential Trading Opportunities
Use the detected formation as one component of your technical analysis. Consider additional confirmation from price action, support and resistance, volume, and other technical indicators before making trading decisions.
Flexible Settings and Parameters
The indicator offers straightforward configuration options organized into several categories.

| Category | Parameter | Description |
|---|---|---|
| Pattern Sizes | Enable Small Pattern | Enable or disable small formations |
| Pattern Sizes | Enable Medium Pattern | Enable or disable medium formations |
| Pattern Sizes | Enable Large Pattern | Enable or disable large formations |
| Parameters | Show Last Pattern Only | Display only the latest detected pattern |
| Parameters | Enable Alert | Enable or disable sound notifications |
| Parameters | Extension Bars | Set the projected extension distance |
| Parameters | Sound Alert File | Specify the notification sound file |
| Line Style | Line Width | Adjust trendline thickness |
| Line Style | Upper Line Color | Customize upper trendline color |
| Line Style | Lower Line Color | Customize lower trendline color |
| Line Style | Extension Line Color | Customize extension line color |
These settings provide flexibility without overwhelming traders with unnecessary configuration complexity.
Suitable for Multiple Trading Markets
Broadening Formation patterns can appear in different financial markets and across different trading instruments.
The Chart Pattern Broadening Formation Indicator can be used for technical analysis of:
- Forex: Monitor expanding price structures across major, minor, and cross-currency pairs.
- Stocks: Identify widening price ranges in individual equities.
- Indices: Analyze expanding market structures in major stock indices.
- Futures: Monitor volatility expansion in futures markets.
- Cryptocurrencies: Identify broadening price structures in highly volatile digital asset markets.
- Commodities: Analyze expanding price movements in energy, metals, and agricultural markets.
Because the indicator operates directly on chart price data, traders can apply it to different instruments and timeframes supported by cTrader.
Why Choose Chart Pattern Broadening Formation for cTrader?
Manual chart pattern identification can be time-consuming, particularly when analyzing multiple instruments and timeframes.
The Chart Pattern Broadening Formation Indicator offers a more efficient approach by automating the identification and visualization of qualifying expanding formations.
Key advantages include:
- Automatic Broadening Formation detection.
- Three independently configurable pattern sizes.
- Automatic upper and lower trendline drawing.
- Projected trendline extensions.
- Optional latest-pattern-only chart display.
- Sound notifications for newly detected formations.
- Customizable trendline colors and widths.
- Simple and flexible configuration.
- Direct integration with the cTrader chart environment.
Whether you are a discretionary price-action trader, technical analyst, or systematic trading developer, this indicator can help streamline your chart analysis and make expanding market structures easier to recognize.
Technical Specifications
| Specification | Details |
|---|---|
| Product Name | Chart Pattern Broadening Formation |
| Trading Platform | cTrader |
| Indicator Type | Chart Pattern Recognition |
| Pattern Category | Broadening Formation / Expanding Formation |
| Chart Display | Overlay on Price Chart |
| Pattern Sizes | Small, Medium, Large |
| Trendlines | Upper and Lower Boundaries |
| Projection | Configurable Trendline Extensions |
| Notifications | Optional Sound Alerts |
| Visual Customization | Colors and Line Width |
| Historical Display | Multiple Patterns or Latest Pattern Only |
Important Trading Considerations
A Broadening Formation is a technical chart structure, not a guarantee of future market direction.
Although expanding formations can highlight important changes in market volatility and price behavior, not every detected pattern will lead to a profitable trading opportunity.
Traders should consider the broader market environment, price-action confirmation, relevant support and resistance levels, and risk management when evaluating potential setups.
The indicator is designed to assist with chart pattern identification and technical analysis. It does not provide guaranteed trading signals or guarantee future market performance.
Take Your cTrader Chart Pattern Analysis Further
Make Broadening Formation identification easier with the Chart Pattern Broadening Formation Indicator for cTrader.
Automate the identification of expanding price structures, visualize important trendline boundaries, monitor projected extensions, and receive optional sound notifications when new formations are detected.
Spend less time manually searching for chart patterns and more time analyzing market structure and evaluating potential trading opportunities.
Get the Chart Pattern Broadening Formation Indicator for cTrader and enhance your technical analysis workflow.