Chart Pattern Channel Down and Channel Up for cTrader
Discover rising and falling price channels directly on your cTrader charts with the Chart Pattern Channel Down and Channel Up indicator. Built for traders who use chart patterns and price action, this overlay indicator automatically highlights potential ascending and descending channel formations, helping you identify structured market movement more quickly.
Whether you trade forex, indices, commodities, stocks, or cryptocurrencies, the indicator gives you a clean visual framework for tracking potential bullish and bearish channel patterns across multiple timeframes.

Identify Bullish and Bearish Channel Patterns
The indicator detects and displays two essential chart formations:
- Channel Up — highlights upward-sloping price channels that can help traders assess bullish market structure, trend continuation, pullback areas, and possible breakout zones.
- Channel Down — highlights downward-sloping price channels that can help traders monitor bearish market structure, rallies within a decline, potential reversals, and breakdown opportunities.
When a valid pattern is identified, upper and lower channel boundaries are drawn directly on the chart, making it easier to evaluate price behavior around support and resistance areas.

Designed for Flexible cTrader Chart Analysis
Chart Pattern Channel Down and Channel Up is fully customizable so you can align it with your trading style and chart preferences. Enable only the pattern direction you want to monitor, or track both bullish and bearish channels at the same time.
You can also scan for different pattern scales:
- Small patterns for more frequent, shorter-term market opportunities
- Medium patterns for balanced intraday and swing-trading analysis
- Large patterns for broader trend structure and higher-timeframe setups
This flexibility makes the indicator suitable for scalping, day trading, swing trading, and multi-timeframe technical analysis.
Key Features
- Automatic Channel Up detection
- Automatic Channel Down detection
- Draws upper and lower channel trend lines on the chart
- Configurable bullish and bearish pattern visibility
- Small, medium, and large pattern-size options
- Adjustable line width for better chart readability
- Separate color settings for bullish and bearish channel boundaries
- Adjustable channel-line extension into future bars
- Optional sound alerts when a new live-chart pattern is found
- Optional latest-pattern display mode for a cleaner workspace
- On-chart pattern marker for detected setups
- Native cTrader indicator controls and color selection
- Works as an overlay directly on the price chart
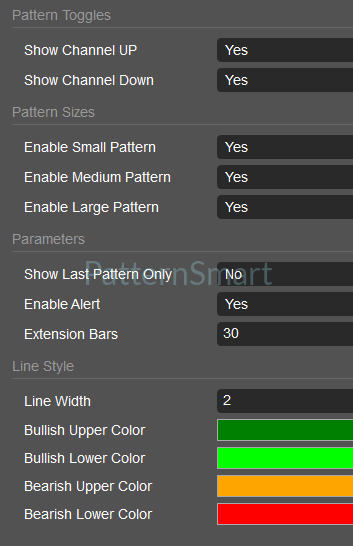
Customize Your Channel Display
Every trader reads charts differently. This cTrader channel pattern indicator lets you tailor the visual layout to your workflow.
Choose distinct colors for:
- Bullish upper channel line
- Bullish lower channel line
- Bearish upper channel line
- Bearish lower channel line
You can adjust trend-line thickness and extend projected channel boundaries forward, helping you keep potential reaction zones visible as new candles form. If you prefer a minimalist chart, use the option to focus on the latest detected pattern.

Real-Time Pattern Alerts
The optional sound-alert feature notifies you when a newly identified Channel Up or Channel Down pattern appears on the current live bar. This helps traders stay attentive to developing chart structures without constantly watching every instrument and timeframe.
Alerts are especially useful when monitoring multiple markets, running multi-chart layouts, or waiting for price to approach channel support, channel resistance, or a potential breakout area.
How Traders Can Use Channel Patterns
Price channels can provide valuable context, but they are most effective when used as part of a complete trading plan. Traders may use this indicator to:
- Assess the current trend direction and price structure
- Identify potential support and resistance within a channel
- Watch for channel breakouts or breakdowns
- Look for pullback opportunities near channel boundaries
- Combine pattern analysis with moving averages, RSI, MACD, volume, or candlestick confirmation
- Define potential entry, stop-loss, and take-profit areas based on market structure
No indicator guarantees trading results. Always confirm signals with your own analysis, risk-management rules, and market conditions.
Ideal for cTrader Traders
Chart Pattern Channel Down and Channel Up for cTrader is ideal for traders seeking an efficient way to spot channel formations without manually drawing every trend line. It brings structured visual pattern recognition to your chart while preserving control over direction, pattern scale, styling, alerts, and display preferences.