Automatically Identify Triangle Chart Patterns Directly on cTrader
Chart Pattern Triangle for cTrader is a professional technical analysis indicator designed to automatically detect and display some of the most widely followed triangle formations in financial markets. Built specifically for the cTrader trading platform, this tool helps traders quickly identify potential market consolidation structures without the need for manual chart scanning.
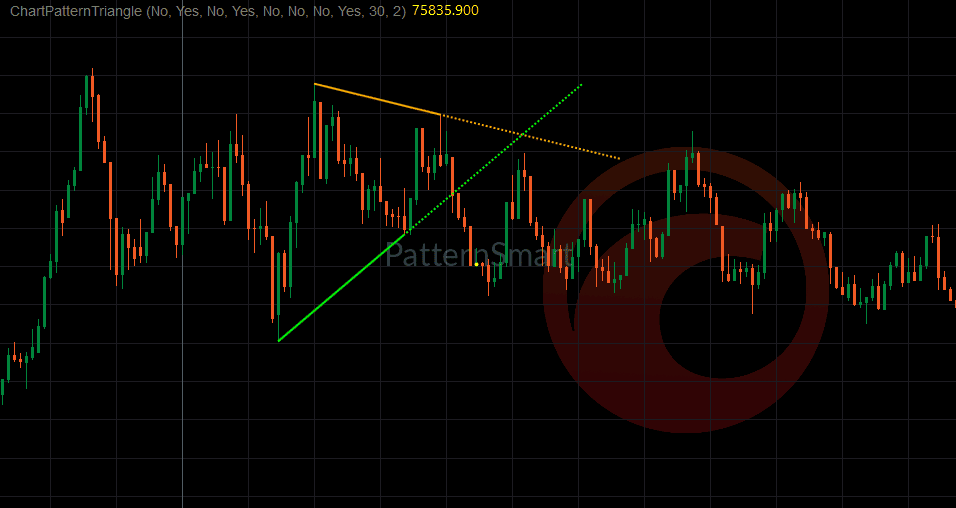
The indicator continuously analyzes price action and highlights valid Ascending Triangles, Descending Triangles, and Symmetrical Triangles directly on the chart. By automatically drawing the relevant trendlines and pattern boundaries, traders can spend less time searching for opportunities and more time focusing on trade planning and market execution.
Whether you trade forex, indices, commodities, cryptocurrencies, or CFDs, Chart Pattern Triangle for cTrader provides a clean and efficient way to monitor developing market structures across multiple instruments and timeframes.
Key Features
Automatic Triangle Pattern Detection
The indicator automatically identifies triangle formations as they develop on the chart. Instead of manually connecting swing highs and swing lows, traders receive visual pattern recognition directly within the platform.
Supported pattern types include:
- Ascending Triangle
- Descending Triangle
- Symmetrical Triangle
This automation helps eliminate the subjective interpretation that often occurs when drawing patterns manually.
Visual Trendline Projection
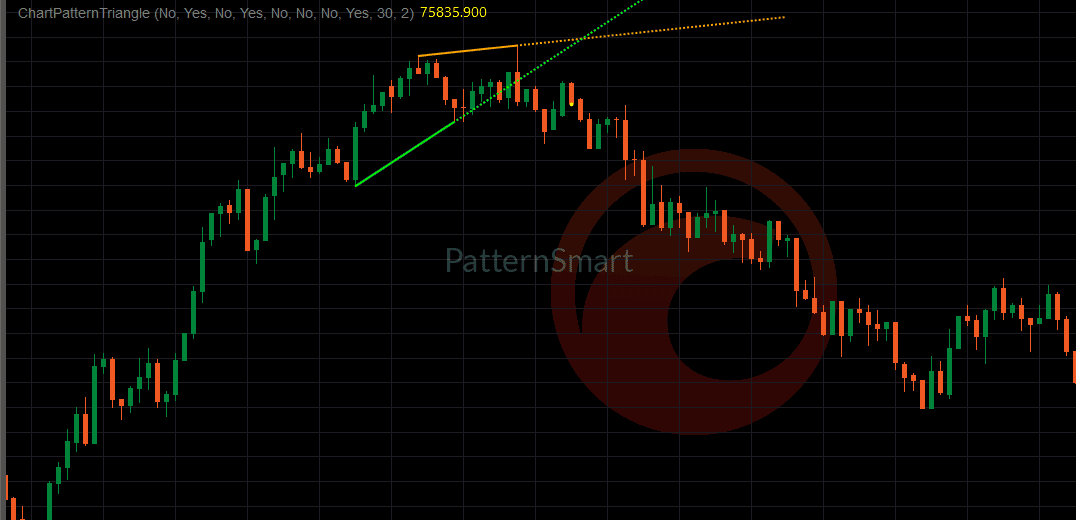
Once a valid triangle structure is detected, the indicator draws the upper and lower boundary lines directly on the chart.
The projected trendlines provide a clear visual representation of the pattern, allowing traders to:
- Evaluate market structure more efficiently
- Monitor contracting price ranges
- Observe potential breakout zones
- Maintain chart consistency across multiple markets
Optional extension lines can also project pattern boundaries into future bars, helping traders visualize ongoing pattern development.
Real-Time Market Monitoring
The indicator continuously evaluates incoming price data and automatically updates pattern recognition as market conditions change.
This allows traders to:
- Detect newly forming triangle patterns
- Follow developing consolidation structures
- Monitor multiple markets without constant manual analysis
- Receive pattern information while markets are active
Built-In Alert System
Chart Pattern Triangle for cTrader includes alert capabilities that can notify traders when a new triangle pattern is identified.
Alerts help reduce the need for constant chart observation and allow traders to stay informed about potentially important technical developments as they occur.
Features include:
- Sound notifications
- Real-time detection alerts
- Optional alert activation
- Custom alert sound selection
Customizable Pattern Scanning
Different trading styles require different market perspectives. To accommodate this, the indicator provides flexible pattern size filtering options.
Users can choose to scan for:
- Small triangle formations
- Medium-sized setups
- Large market structures
This flexibility makes the indicator suitable for a broad range of trading approaches, including:
- Scalping
- Day trading
- Swing trading
- Position trading
Traders can activate only the pattern sizes that match their preferred timeframe and market strategy.
Advanced Display Controls
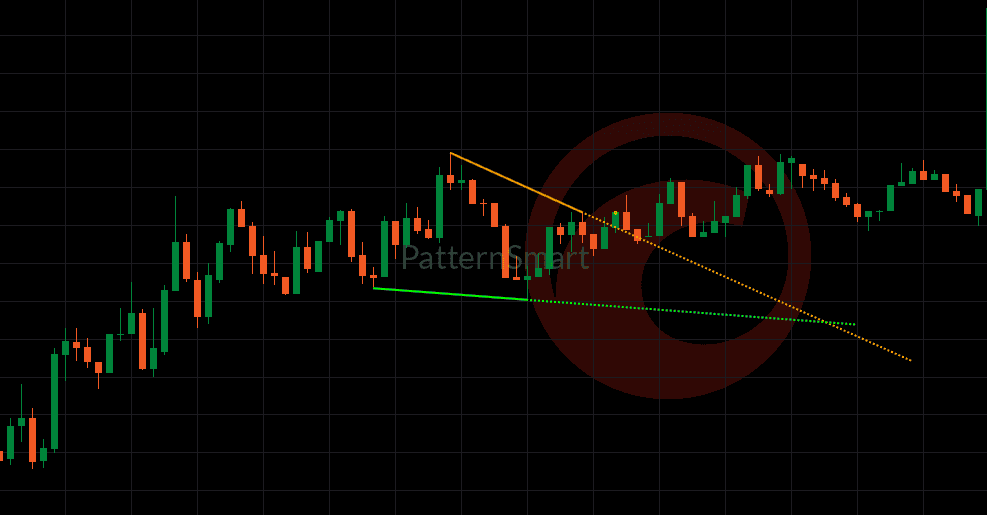
To help maintain a clean and organized workspace, the indicator offers multiple visualization settings.
Pattern Type Selection
Enable or disable specific pattern categories:
- Ascending Triangle
- Descending Triangle
- Symmetrical Triangle
This allows traders to focus exclusively on the setups most relevant to their trading methodology.
Show Latest Pattern Only
For traders who prefer uncluttered charts, the indicator can display only the most recent valid pattern while suppressing older formations.
This feature is especially useful when analyzing fast-moving markets or lower timeframes.
Custom Line Styling
Personalize chart appearance with configurable visual settings, including:
- Trendline colors
- Line width
- Pattern visibility preferences
- Extension line display
The result is a trading environment that matches your personal chart layout and workflow.
Why Choose the cTrader Version?
Native cTrader Integration
Unlike generic chart pattern tools adapted from other platforms, this version has been specifically developed for the cTrader ecosystem.
The indicator integrates directly into cTrader’s charting environment and works with the platform’s native:
- Chart rendering engine
- Trendline drawing system
- Alert framework
- Indicator architecture
This provides a smooth and responsive user experience while maintaining the appearance and functionality that cTrader traders expect.
Optimized for cTrader Charting
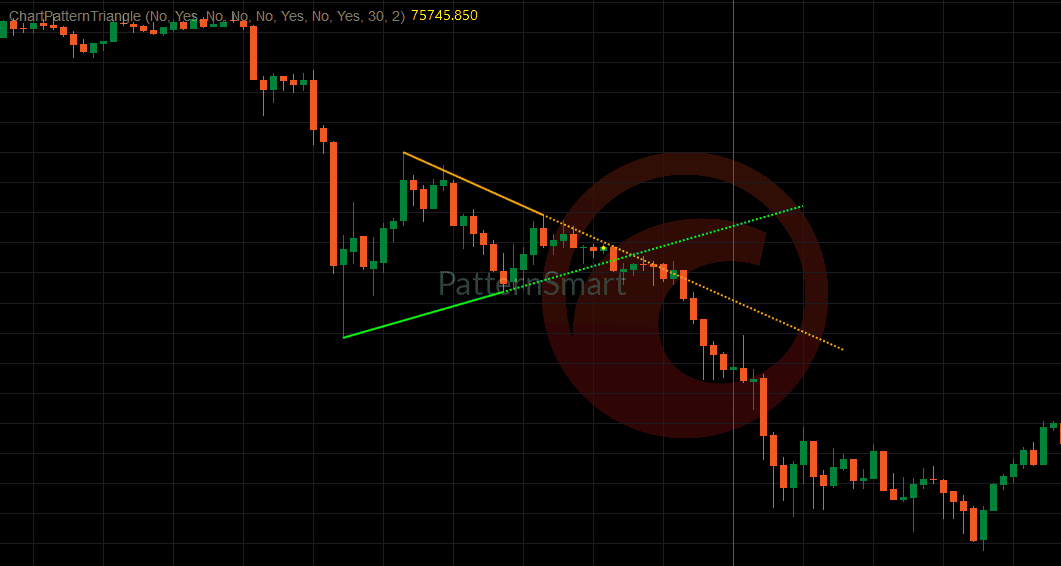
cTrader is widely recognized for its advanced charting capabilities and modern trading interface. Chart Pattern Triangle takes full advantage of these strengths by displaying pattern structures directly within the native chart window.
Benefits include:
- Seamless visual integration
- Clear chart overlays
- Efficient pattern visualization
- Consistent chart behavior across instruments
Multi-Asset Compatibility
The indicator can be used across all markets supported by cTrader, including:
- Forex pairs
- Stock indices
- Commodities
- Precious metals
- Cryptocurrencies
- CFDs
This allows traders to utilize the same pattern recognition workflow throughout their entire watchlist.
Timeframe Flexibility
Chart Pattern Triangle works on virtually any timeframe available within cTrader.
Whether analyzing:
- 1-minute charts
- 15-minute charts
- Hourly charts
- Daily charts
- Weekly charts
the indicator helps identify triangle formations that align with the selected market perspective.
Improve Technical Analysis Efficiency
Triangle formations remain among the most recognized price action structures used by technical traders. However, locating them manually can be time-consuming and subjective.
Chart Pattern Triangle for cTrader streamlines this process by automatically recognizing qualifying formations, visually presenting them on the chart, and notifying traders when new opportunities emerge.
By combining automated pattern recognition, customizable scanning options, visual trendline projection, and native cTrader integration, the indicator delivers a practical solution for traders seeking a more efficient approach to chart pattern analysis.
Ideal For
- Price action traders
- Technical analysts
- Breakout traders
- Forex traders
- CFD traders
- Cryptocurrency traders
- Swing traders
- Day traders
- Multi-market cTrader users
Chart Pattern Triangle for cTrader helps traders quickly identify important triangle formations, reduce chart analysis time, and maintain a structured approach to market analysis within the powerful cTrader trading platform.
Add it to your cTrader chart today and let the Triangle come to you.