Automatically Detect Rectangle Consolidation Patterns and Breakout Opportunities
Chart Pattern Rectangle for cTrader is a professional chart pattern recognition indicator that automatically identifies Rectangle formations and highlights potential breakout opportunities directly on your cTrader charts. Designed for traders who rely on technical analysis and price action, this indicator eliminates the need for manual pattern scanning while helping traders identify important consolidation zones and potential future market moves.
Rectangle patterns are among the most widely recognized chart formations in technical analysis. They occur when price trades within a well-defined horizontal range, creating clear support and resistance boundaries. These consolidation periods often precede significant market movements, making Rectangle patterns valuable tools for traders across all markets and timeframes.
By automatically detecting these formations, drawing the key price boundaries, and monitoring breakout conditions, the indicator helps traders analyze market structure more efficiently and react faster to emerging opportunities.
Key Features
Automatic Rectangle Pattern Detection
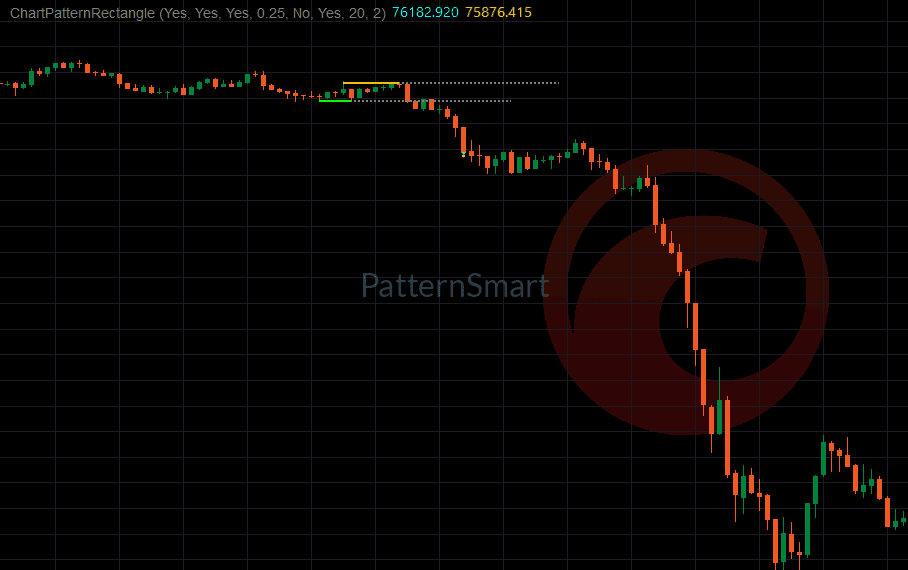
The indicator continuously scans price action and automatically identifies valid Rectangle chart formations as they develop.
Once detected, the pattern is displayed directly on the chart, allowing traders to quickly recognize consolidation zones without manually drawing support and resistance levels.

Built-In Breakout Monitoring
In addition to identifying Rectangle formations, the indicator actively monitors potential breakout activity after a pattern has formed.
The system tracks both:
- Bullish breakouts above resistance
- Bearish breakouts below support
This functionality helps traders stay informed when price moves outside the established consolidation range.

Multiple Pattern Size Detection
Different trading styles require different pattern perspectives. The indicator supports multiple pattern categories, including:
- Small Rectangle patterns
- Medium Rectangle patterns
- Large Rectangle patterns
This flexibility allows traders to customize detection settings based on their preferred markets, timeframes, and trading strategies.
Automatic Support and Resistance Visualization
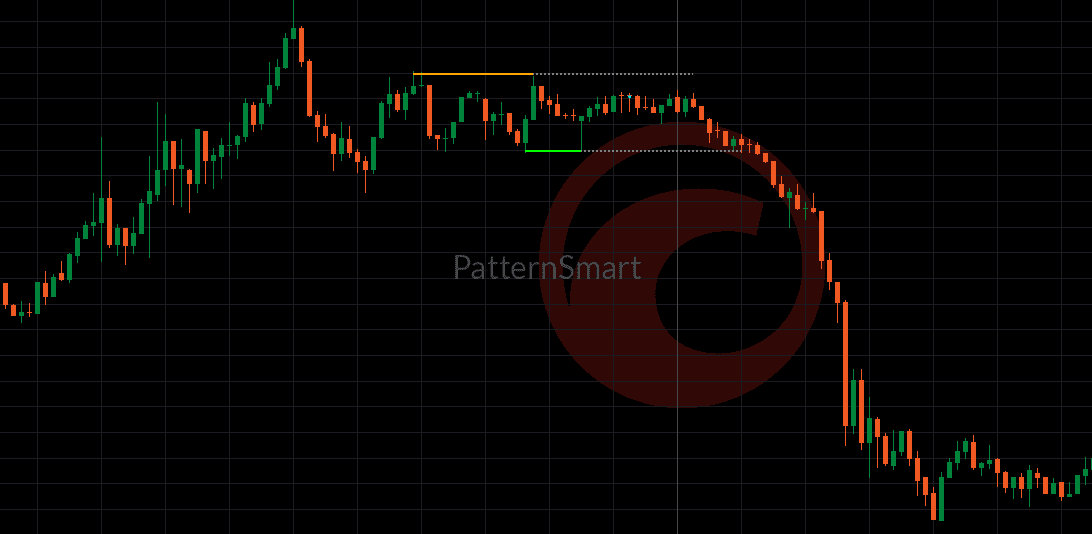
When a Rectangle pattern is detected, the indicator automatically draws:
- Upper resistance boundary
- Lower support boundary
- Extension lines for future price monitoring
- Pattern markers for easy identification
The result is a clean and professional display of the trading range directly on the chart.
Real-Time Pattern Alerts
Never miss an important market development.
The indicator includes:
- Pattern detection alerts
- Breakout alerts
- Sound notifications
- Real-time chart updates
Alerts help traders identify both newly formed Rectangle patterns and breakout events as they occur.
Extension Line Projection
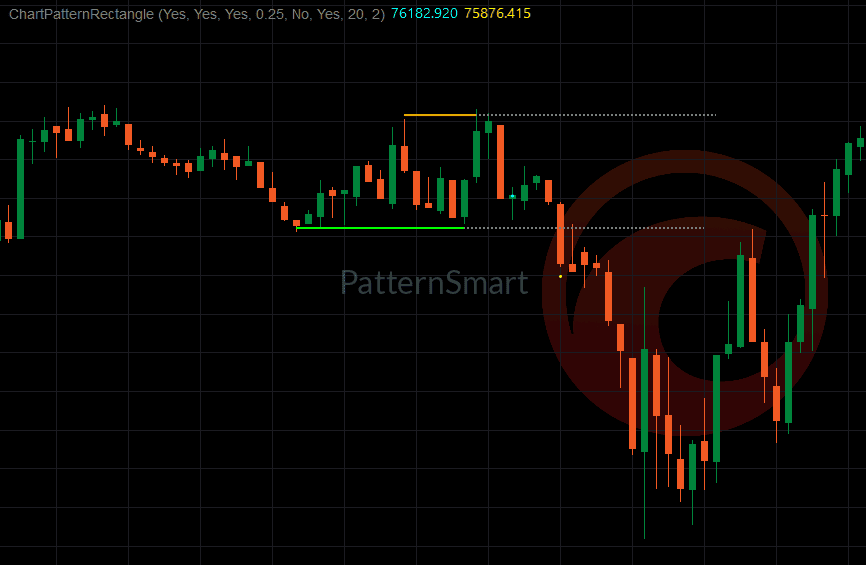
To assist with future price monitoring, the indicator can project support and resistance levels forward on the chart using extension lines.
This feature helps traders:
- Monitor future breakout zones
- Track consolidation boundaries
- Prepare for potential trading opportunities
- Improve chart clarity
Show Latest Pattern Only Option
For traders who prefer a clean chart environment, the indicator includes the ability to display only the most recent Rectangle pattern.
Benefits include:
- Reduced chart clutter
- Improved visual clarity
- Enhanced focus on active market structures
- Easier trade analysis
Highly Customizable Settings
The indicator allows traders to customize its appearance and functionality according to their trading preferences.

Available settings include:
- Pattern size filters
- Pattern sensitivity controls
- Alert activation settings
- Support and resistance colors
- Extension line colors
- Line thickness controls
- Extension range settings
- Sound alert customization
Benefits for Traders
Save Time with Automated Analysis
Manually searching for Rectangle formations across multiple charts can be both time-consuming and inconsistent. The indicator automates the entire process and continuously scans market data for you.
Identify Consolidation Zones Quickly
Rectangle patterns often represent periods of equilibrium between buyers and sellers. Automatic detection helps traders quickly recognize these important market conditions.
Spot Potential Breakouts Earlier
Because the indicator actively monitors breakout conditions after a pattern forms, traders can react more efficiently when price exits the consolidation range.
Improve Market Structure Analysis
The indicator enhances chart readability by automatically highlighting critical support and resistance areas associated with Rectangle formations.
Increase Analytical Consistency
Automated detection reduces subjective interpretation and helps create a more disciplined and objective trading workflow.
Common Trading Applications
Chart Pattern Rectangle for cTrader can be used for:
- Range trading strategies
- Breakout trading strategies
- Support and resistance analysis
- Market consolidation identification
- Technical pattern recognition
- Price action trading
- Trend continuation analysis
- Reversal setup evaluation
- Multi-timeframe market analysis
The indicator can also be combined with moving averages, momentum indicators, volume analysis, and other technical tools for additional confirmation.
Suitable for All Market Types
The indicator works across virtually every market supported by cTrader, including:
- Forex
- Stocks
- Indices
- Commodities
- Precious Metals
- Cryptocurrencies
- Futures
- CFDs
Because Rectangle formations are universal market structures, the indicator can be applied to almost any tradable instrument.
Why Choose Chart Pattern Rectangle for cTrader?
Rectangle patterns are among the most reliable and frequently occurring consolidation formations in technical analysis. However, manually locating valid rectangles and continuously monitoring breakout levels can be difficult, especially when managing multiple charts.
Chart Pattern Rectangle for cTrader simplifies this process by automatically identifying Rectangle formations, plotting support and resistance boundaries, extending key levels into future price action, and monitoring both bullish and bearish breakout scenarios.
With automatic detection, real-time alerts, customizable visual settings, breakout monitoring, and clean chart presentation, this indicator provides traders with a powerful solution for identifying consolidation structures and potential trading opportunities.
Compatibility
Platform: cTrader
Markets: Forex, Stocks, Indices, Commodities, Precious Metals, Futures, CFDs, Cryptocurrencies
Timeframes: All cTrader Timeframes
Trading Styles: Scalping, Day Trading, Swing Trading, Position Trading
Installation: Fully Integrated cTrader Overlay Indicator
Conclusion
Chart Pattern Rectangle for cTrader is a comprehensive pattern recognition indicator designed to automatically detect Rectangle formations, display support and resistance boundaries, monitor breakout opportunities, and provide real-time notifications. Whether you are a breakout trader, range trader, or technical analyst, this indicator helps streamline chart analysis, improve market structure recognition, and identify potential trading opportunities with greater confidence and efficiency.
Add it to your cTrader chart today and let the Rectangle come to you.